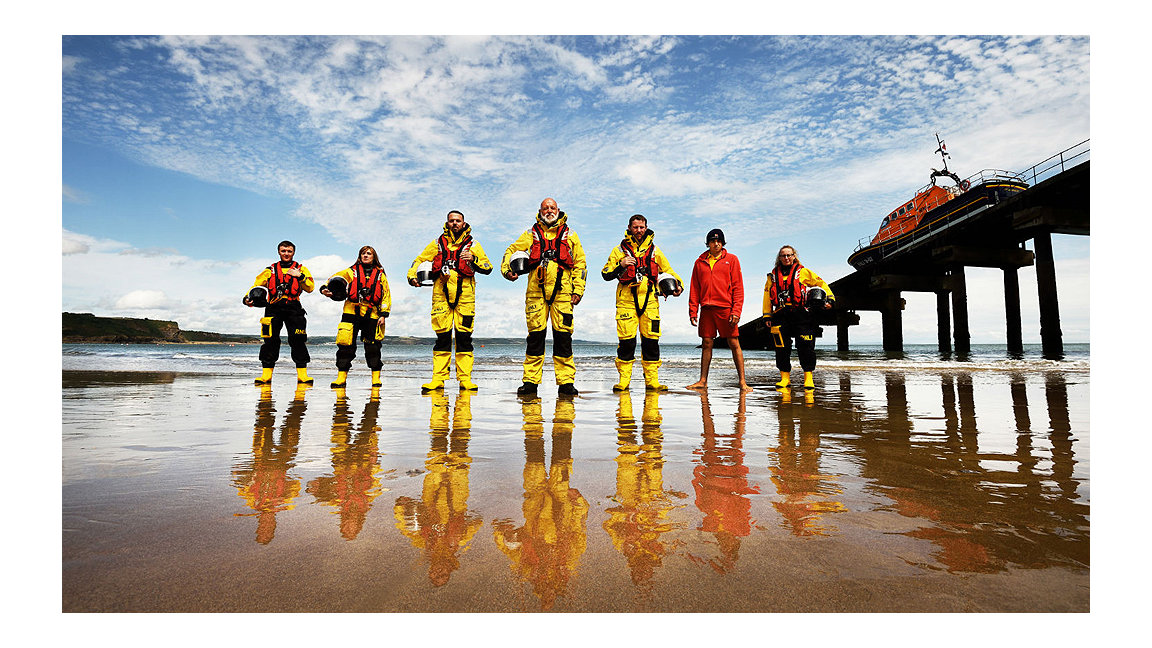
RNLI crew group shot, © RNLI
Land Journal: Most people will be aware of the Royal National Lifeboat Institution (RNLI). But could you give a bit of background about its history and structure?
Matthew Wright: The RNLI was formed almost 200 years ago in 1824, and funded entirely by voluntary donations, to provide search and rescue (SAR) cover across the seas around Great Britain and Northern Ireland, the Republic of Ireland, the Isle of Man and the Channel Islands.
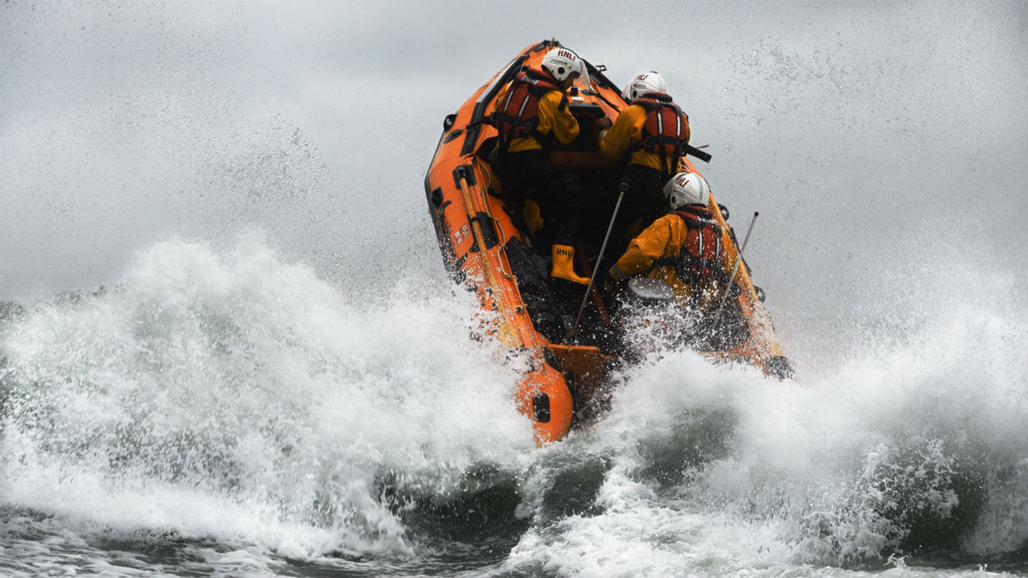
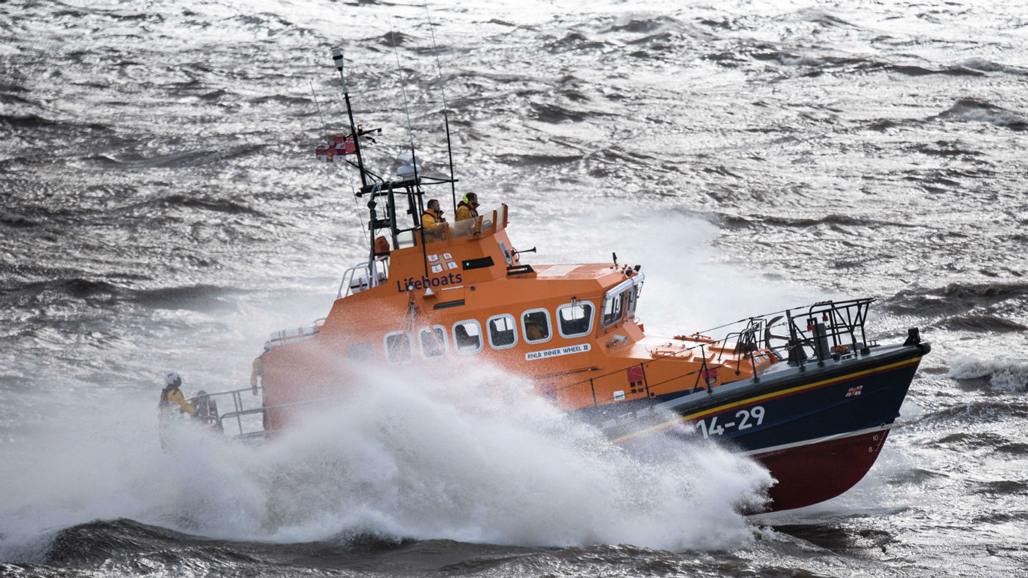
Over the years, lifeboats have come on considerably from crewed rowing boats to the powered fleet we now have today, including hovercrafts. Since 1824, our volunteers have launched our lifeboats 353,218 times and saved 142,700 lives at sea.
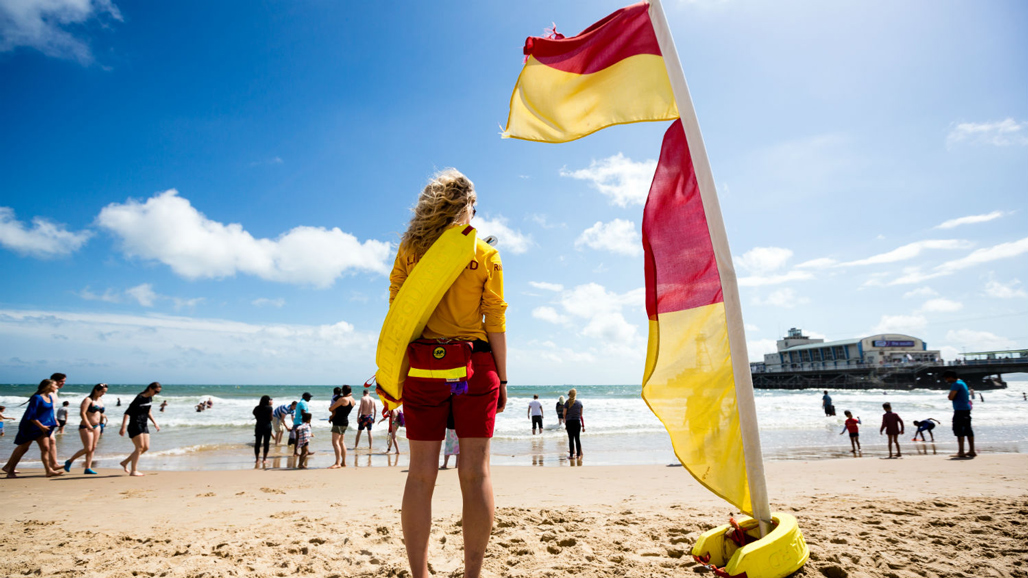
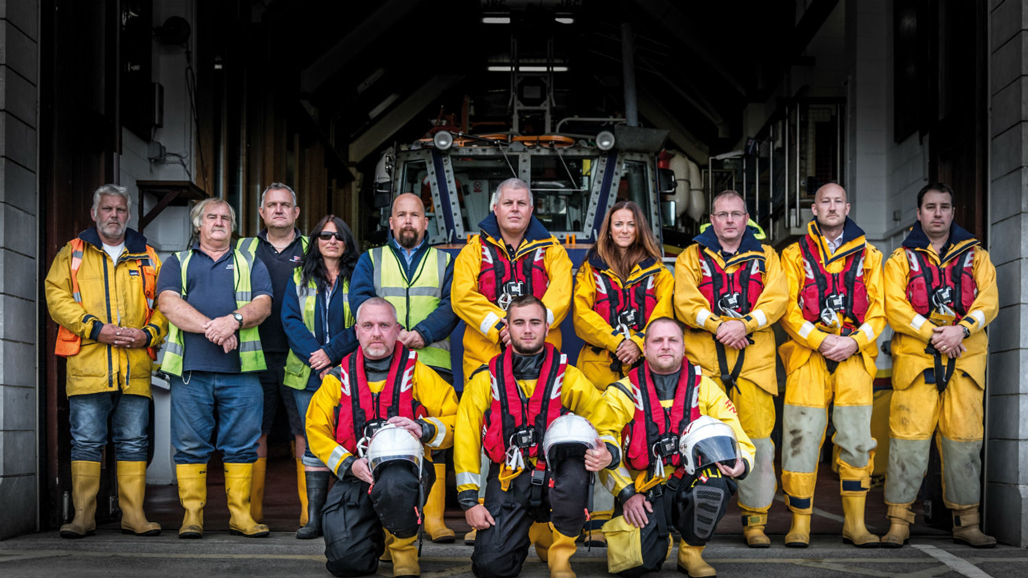
The charity currently has more than 5,500 operational volunteer crew that operate lifeboats from 238 lifeboat stations, alongside a seasonal lifeguard service on around 248 beaches. Lockdown is one of the biggest challenges to the way we work, with our volunteers and staff under pressure to maintain our SAR service as more people are staying at home. We're doing a lot of work to get our lifeguards and beaches ready for this summer.
LJ: The RNLI has been using marine charts for almost 200 years. When did you start to use digital spatial data and GIS, and has their use changed in recent years?
MW: All our boats carry digital and paper charts. We collect the information on every call-out, including location, the type of incident and other details such as who was on the crew, what time of day it was and what the weather was like.
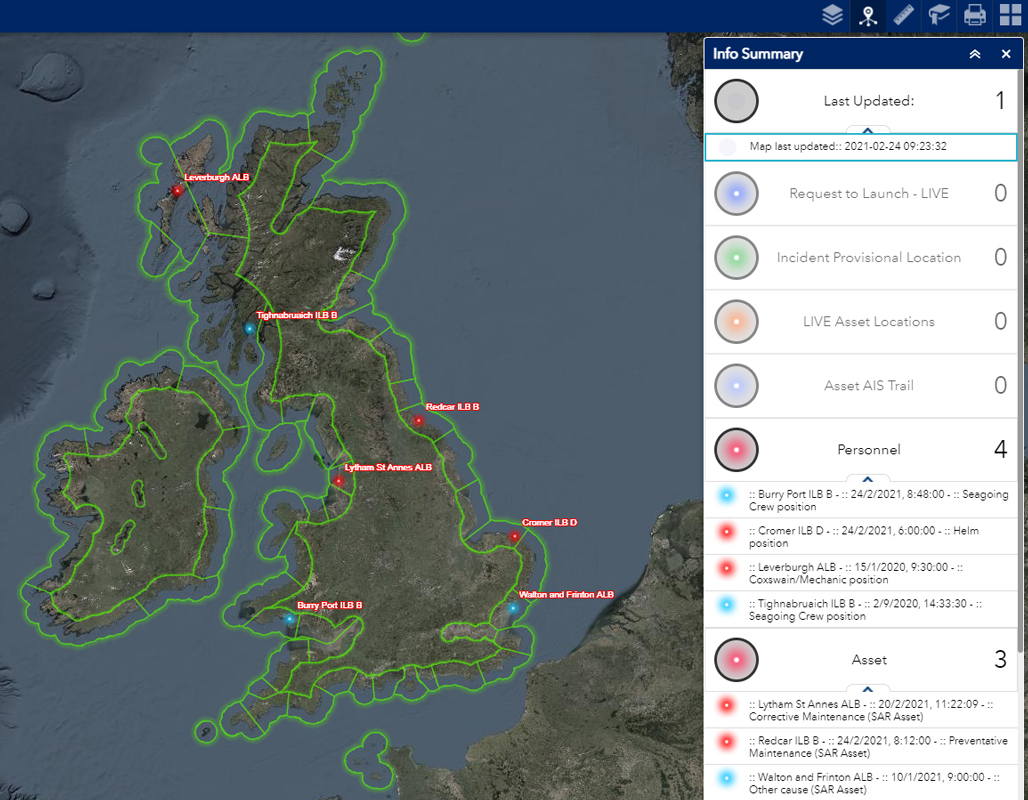
Our current GIS system has been used for almost seven years within the institution. Two years ago, our central operations team tasked the Analytics, GIS and Data Science team to provide a real-time application showing where our lifeboat fleet is positioned at any one time, what is available to launch and what isn't, which stations are on service, which stations aren't and why. We linked our core enterprise resource planning (ERP) database with a cloud-based GIS web-mapping application to achieve this, creating a live webmap enhanced with the automatic identification system (AIS) positional data from our fleet.
The application helps visualise the lifeboat service status data enabling it to be analysed effectively so we can start to see trends in terms of incident types, times and areas, and identify risk hotspots. For example, the fishing industry may wane in one area and tourism may take over, bringing different kinds of people in and creating different types of risk. The application allows us to look at the bigger picture and be forward-looking.
The application was originally built for an operations room with a big screen on the wall where a small team works day and night. Now we've got over 600 people using it on their mobiles, laptops and desktops. The data is telling an accurate story: every five minutes, we're seeing exactly where our boats are and what is happening around the coast. We use that data to make sure we've got the right boats and the right watercraft in the right place.
LJ: How does this differ from when things were paper-based?
MW: Stations would communicate with their neighbouring or flank stations and local management, but at a national level, we had no overview. Now we've got this holistic view that we can share with everyone at a local level as well.
For example, we can now see the impact if neighbouring lifeboats are to be hauled out of the water for maintenance at the same time. It starts to widen the picture of what support is available if we were to have a large incident and enable us to plan any response accordingly.
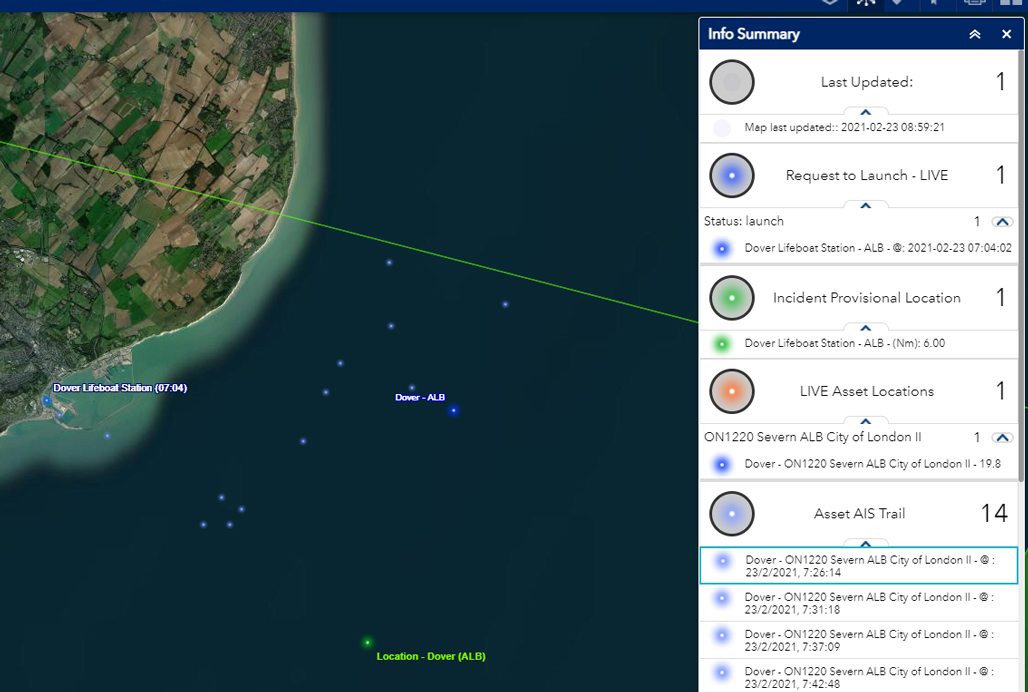
When we have a live launch, we can also trace the boat location.
As more data goes into this map, it has helped to drive the way lifeboat operations are managed by providing an accurate real-time view of the whole lifeboat fleet in one place. It's great to see how the GIS map is changing the way people are working. The application has won a few awards including the IT Industry award. This application has helped raise the profile of GIS in the RNLI, and we've seen demand across the organisation with departments wanting their own bespoke mapping as a result.
LJ: Where would you like to go next with it?
MW: When lifeboats go out on a service call and return to base, volunteers in the station record all the service information manually into the front end of our Lifesaving Activity Reporting Database. This will include information from the crews and from those rescued if available.
But as we move towards gathering digital information for boat service calls, including tracking the boats, the weather, the tides and the currents we can move closer to automatically storing service data and remove the time spent manually inputting by the volunteers.
We would envisage that when the boat returns to the station the information that needs recording will be reduced as we can complete much of the service record automatically. We can then start using this data to ask questions such as, was it a safe launch? Was the weather within tolerance for that class of boat? Which crew did we have onboard? Is there any Trauma Risk Management (TRiM) support needed for particularly difficult or dangerous shouts?
As we start analysing the data we can also become more proactive and predicitve. For example, we can monitor crew hours at sea from a welfare perspective to ensure that they remain fit and well.
LJ: What more could be done with the data?
MW: Our aims are to continue gathering more accurate information to inform our processes and management. Climate change is obviously on everyone's agenda, and we're also looking at that in terms of our coasts, the water users and how it potentially may affect our stations operations.
Another area we are looking at is the digital recording of information from our lifeguarded beaches. In England, Wales and Scotland and Northern Ireland, our seasonal lifeguard teams on the beaches are manually recording how many people are there every two hours, any incidents and how many people are in the water, environmental hazards such as rip currents. This year we're looking at piloting automated processes using AI and machine learning to do the counting and number crunching, and even to analyse and alert us to rip currents.
This means that all the manual digitisation of the paper copy lifeguard forms, traditionally done at the end of the season, may become a rapid data cleansing process and not a laborious data entry job. This will help inform safety campaigns and making sure you've got the right signage on the right beaches. It could help us understand better which beaches are at higher or lower risk, and whether that risk is changing or staying the same.
Last year we made all our incident data from 2008 openly available along with our core datasets such as lifeboat station locations. The number of people who have referenced and reused our open data is very encouraging. The data is tagged as authoritative and it might just be a simple dot on the map showing where the lifeboat station, the boat, or the lifeguard unit is, but users know it can be relied upon.
LJ: How are people using the open data?
MW: Local authorities are embedding the open data in their GIS because they know that it is up to date, and they can trust it. If a member of the public wants to see whether or not a beach is lifeguarded, it's easy to go to our website with a bit more data about what's actually happening that day as well. We hope this is just the start of getting data out there, and it is always interesting to see how people use our open data.
"Local authorities are embedding the open data in their GIS because they know that it is up to date, and they can trust it"
LJ: Do you work with the UK Hydrographic Office (UKHO)?
MW: We've been using its charts on all our vessels for years as well as onboard digital mapping systems, and we use the same admiralty charting map products in the application to record incidents by the lifeboat crew.
We are looking to use the bathymetry mapping for the depths information, the navigation channels and how the navigation routes are changing and for incident analysis. The UKHO is starting to release significant amounts of application programming interfaces (APIs) such as tidal meters, which we are starting to consume as well to support our incident recording. There's a lot of data out there, and we're excited to be working towards making the best use of what is available.
LJ: Do you partner with any other bodies?
MW: We're working towards a data-sharing agreement with the Maritime Coastguard Agency (MCA) this year: we are one of the SAR assets that the coastguard and the other emergency services have at their disposal.
When you dial 999 or 112 and ask for the coastguard, they can call any of our stations and ask to launch a particular kind of boat or asset, which they can support with their own rescue craft such as a helicopter. At present, a lifeboat station reports its status to both the MCA and to our operations team.
Ideally, we'd like to work with the MCA so the coastguard would see our fleet status data, while we would start to see MCA data relevant to our service. If both organisations are looking at one version of which assets are available, then the MCA who are making those split-second decisions to launch will know where our boats are, their service status, which flank stations are open, and what assets they could use.
"We'd like to work with the MCA who are making split-second decisions to launch, so they will know where our boats are, their service status, which flank stations are open, and what assets they could use"
LJ: Where do you go from here?
MW: We're now seeing the power of GIS and data, but obviously it has to be underpinned by reliable data so we are striving for quality. The RNLI is now making evidence-based decisions using our team's applications. Operational staff can rely on it because it's authoritative, it's live and becoming more reactive. It's getting to the point where we know what's happening now, and we can start to predict what might happen.
Our predictive modelling and analysis is looking to see if we have the right boats we need at the right stations and whether a given station is suitably located. We're not just simply saying that a map indicates where boats are and are not needed. There are many factors that influence the decision-making process which makes it all the more imperative that our data is the best it can be.
Our goal would be that all our staff can access an interactive map of all the RNLI spatial data. You could then filter, say, 'rescues of surfboarders in west Cornwall', make a map of this quickly and stick it in a report. You wouldn't need to worry about the data because it's all authoritative, from one source and totally reliable.
