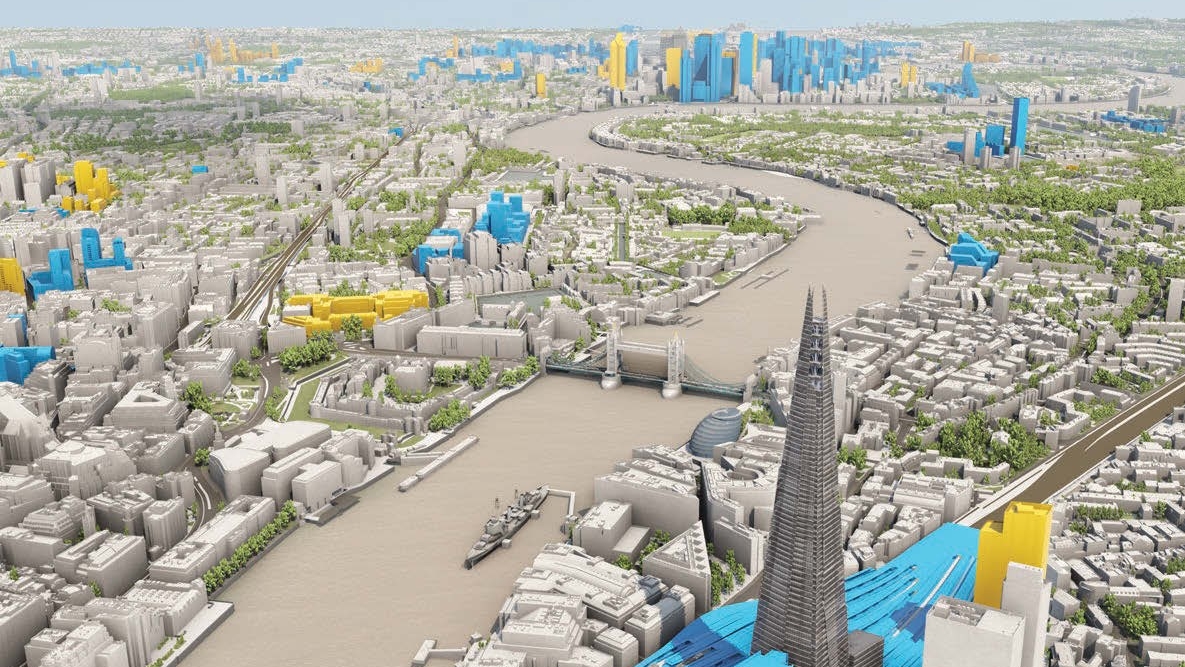
View towards Canary Wharf demonstrating changing development across the capital: the yellow buildings demonstrate all major consented schemes, and the blue, consented schemes under construction, © VU.CITY LIMITED
Land is at such a premium in our major cities that identifying and making the most of opportunity areas is more important than ever before. But smart-city platforms are for the first time enabling us to combine complex mass data sets to inform and shape the built environment. As this technology evolves, the possibilities for the planning profession are limitless.
The opportunities on any site are determined not only by its physical boundaries but numerous factors including technical constraints, environmental considerations and layers of planning policy. Seeing these boundaries is often the key to ensuring a scheme's success.
Historically though, that has not been easy. Simply comprehending the physical boundaries of a site for example has depended on two-dimensional plans that may not be accurate. This makes schemes costly and entails time-consuming testing of proposals against criteria that are rarely visible side by side.
Smart-city and planning technology platforms are already altering this process, enabling developers and local authorities to understand schemes more clearly. A key factor is the ease of access this technology offers to mass sets of data: platforms can provide an interactive 3D map of entire cities, accurate to within 15cm, including all current and consented schemes. Users can input their proposals and assess their impact from any viewpoint in the city in seconds. Mapping a site to understand its physical boundaries can be done quickly, accurately and easily, and the context can also be viewed alongside the current and future environment.
"Mapping a site to understand its physical boundaries can be done quickly, accurately and easily"
But perhaps the most exciting prospect for this type of technology is the ability to combine multiple data sets in one location – incorporating, for example, traffic flows, daylight and sunlight assessments, protected views, local plans, wider planning policy and environmental impacts. Project teams can test their schemes against these factors in one place, and the constraints in which they must work are transparent.
Case study
The City of London's planning team was looking to identify opportunity areas for development in what is already one of the capitals most densely developed boroughs. In such a central location, the only obvious opportunity that remained was to go upwards, so the team looked for sites where height could be most appropriately increased.
One of the biggest restrictions was the decades-old protection on views of St Paul's Cathedral, limiting the height to which certain corridors could be developed. The borough had previous issues with plans for developments that infringed these views, but could not easily or accurately see the boundaries for these restrictions. This made mapping the true potential of the City a near impossible task.
Using VU.CITY, however, the planning team can review all the accurately mapped protected views of St Paul's. The 3D interactive model of the City allows them to identify easily projects that would have an impact on the protected views. This visual representation of the upper building limits has enabled the team to understand the scope for future development in the borough and suggest how the height of schemes might be increased to make full use of the site in permitted developments. The planning team will in future be able to make the best use of sites while protecting the important heritage of views that may otherwise come under pressure from developers.
Creating mass data hubs
Evolving data hubs combine these multiple, complex data sets about buildings, cities and even entire regions. Compiling this information in one place and making it transparent and accessible naturally promotes improved design and build – there is less need for sacrifices on a particular build when we can test viable alternatives quickly.
Because parameters can be assessed so easily, we also encourage collaboration city by city. For example, pedestrian flows across New York could be assessed against those in London and, if one is performing better than the other, developers and city planners might ask why and use that insight to improve the streets. The same comparisons could be made for environmental performance or the impacts of development on daylight.
We can look across an entire city and establish where the opportunities are and what the best use of those sites may be, given all the relevant factors. More than that, we can quickly assess the limitations on that site – are there protected views, for example, or traffic or environmental implications? What type of development would work there? How would it compare to what exists and what is coming forward on nearby sites? Much of this information is already available, but accessing it is costly and time-consuming.
Perhaps the most important principle in this new age of mass data sets is transparency. The planning system tends to be inaccessible to those outside the sector because of the complex way in which information is presented. Environmental impact assessments that run to hundreds of pages, long transport assessments and detailed descriptions of schemes in complex planning jargon deter the general public from reading even what they can access.
"Perhaps the most important principle in this new age of mass data sets is transparency"
Smart-city technology instead enables complex information of this type to be presented simply using visuals and data. Some smart-city platforms make it possible for users to take a virtual tour of a site, and taking a 'walk' around a scheme that is accurately represented in its surroundings means that impacts on neighbouring buildings can be easily seen and understood and images of proposed schemes extracted. Real-time demonstrations will clearly show the proposed impact on traffic and pedestrian movements, allowing users to see the change rather than simply reading the figures in a technical report.
This transparency can improve working relationships between the development sector and local authorities. The technology acts almost as a trustworthy mediator through which the developer can be sure the local authority's policies are being accurately represented and the authority can rely on the representation of the proposed scheme. Smart-city technology in planning is about helping professionals to make the best decisions about what should be built and where. But as they evolve, the platforms we use to embed these mass data sets will start to become a blueprint of how to build the perfect city.
This technology can make planning and design quicker, more streamlined and cheaper for everyone involved, and lead to smarter regulation based on a wealth of accurate data, so we can make better decisions about where housing, schools, GP surgeries and so on should be built.
As site boundaries become easier to see and understand, the number of irrelevant objections to a proposal should be reduced, and planners should be able to handle a greater number of schemes that they can assess at the first go because they have met the relevant criteria throughout the process.
Jason Hawthorne is chief digital officer at VU.CITY j.hawthorne@vu.city
Gordon Ingram MRICS is director at VU.CITY g.ingram@vu.city
Related competencies include: Planning and development management, Remote sensing and photogrammetry, Spatial planning policy and infrastructure