Illustration by Owen Gildersleeve. Photos courtesy of UKHO
The earth's surface is almost entirely known to us. After all, mankind has been exploring for thousands of years, sometimes out of mere curiosity, sometimes to exploit natural or human capital. The history of exploration isn’t always pretty, but combined with modern technology we do have a pretty good idea of what is located where.
What lies beneath the surface of our seas and oceans is a different matter altogether. Frankly, we don’t know terribly much – and what we think we know, often proves itself to be wildly inaccurate once re-examined using cutting edge hydrographic techniques. How far has modern hydrography taken us? And how is that knowledge being used?
One of the world’s foremost authorities on the subject is the United Kingdom Hydrographic Office (UKHO), an executive agency of the Ministry of Defence. “We’re responsible for the production of navigational charts and supporting the navigational needs of the country, as well as across the globe – over 90% of large ships trading internationally rely on our data for safe navigation,” says Robert Clarke, UKHO’s hydrographic programmes manager. “We support the Royal Navy with information that helps them with safe navigation and national security by charting the seas they operate in, so they can work out what they can do and where they can go.”
There are multiple departments within the UKHO, all with different functions. One is concerned with chart production while another processes the data that is used to create the charts in the first place. From a surveyor’s perspective, however, Clarke’s division is the most interesting as it is his and his team’s job to work out how to gather the data in the first place.
“We manage the data gathering programmes that take place around the world,” he says. “They contribute to gathering enough information to build a chart that then gets published and sold to customers. Those customers could be cargo ships, passenger ships, fishermen or anybody else who needs to go out onto the sea. They need to know what their surroundings are like, what the depth of water is, where the rocks are and so on.”
"When we go back to places today with modern measuring techniques, we can sometimes see those early navigators were probably not that far out” Robert Clarke, United Kingdom Hydrographic Office (UKHO)
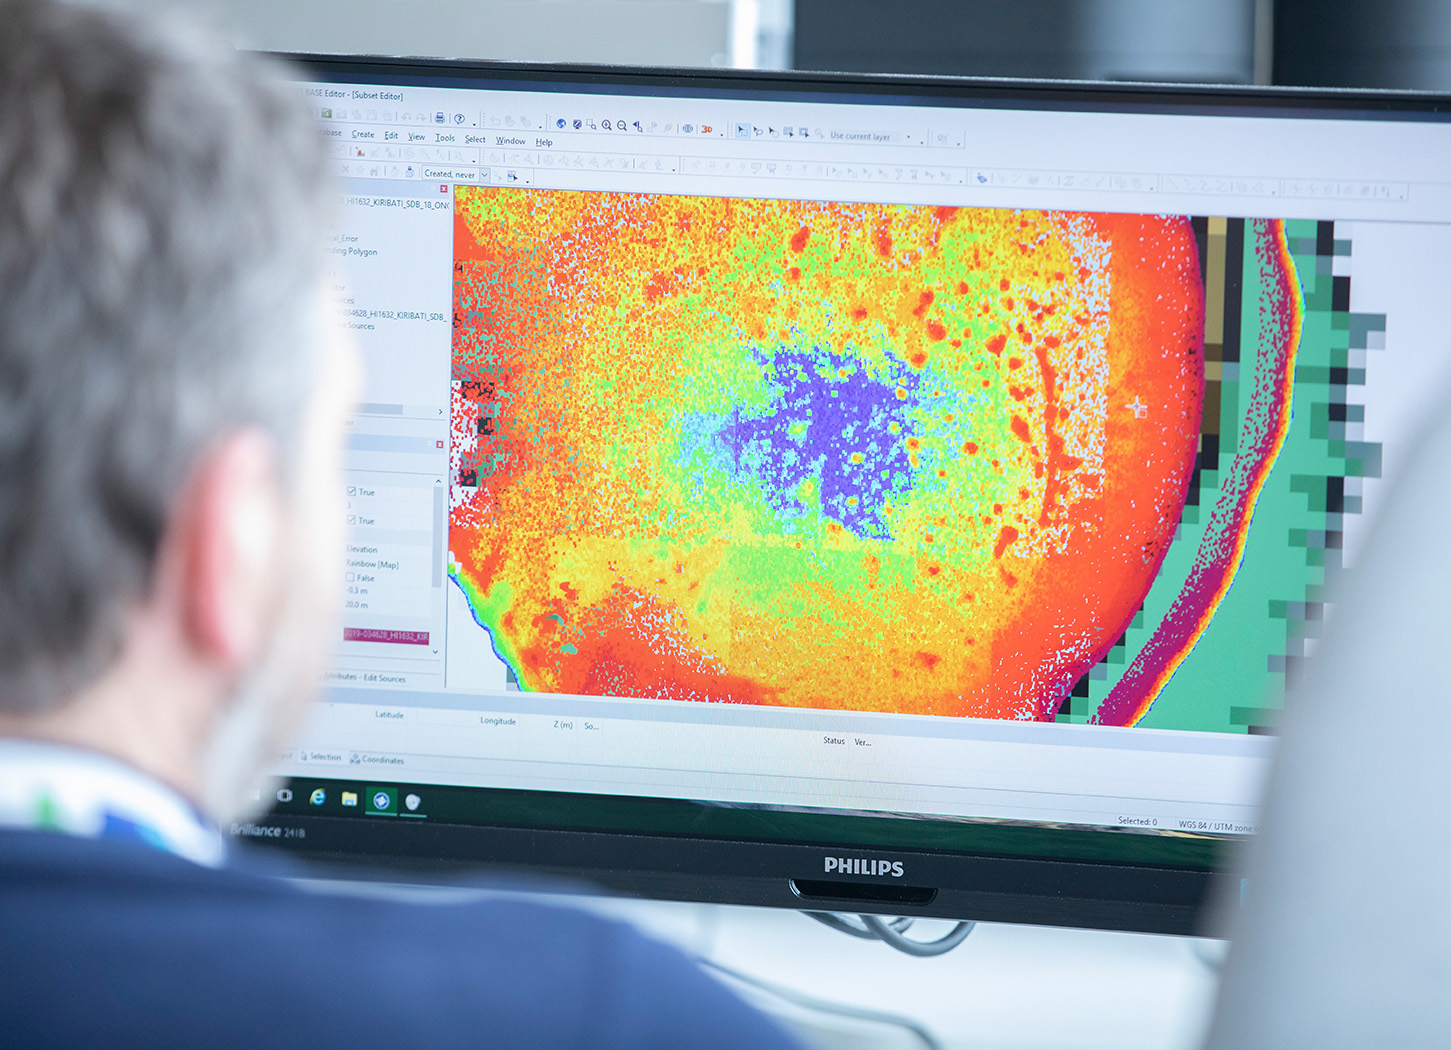
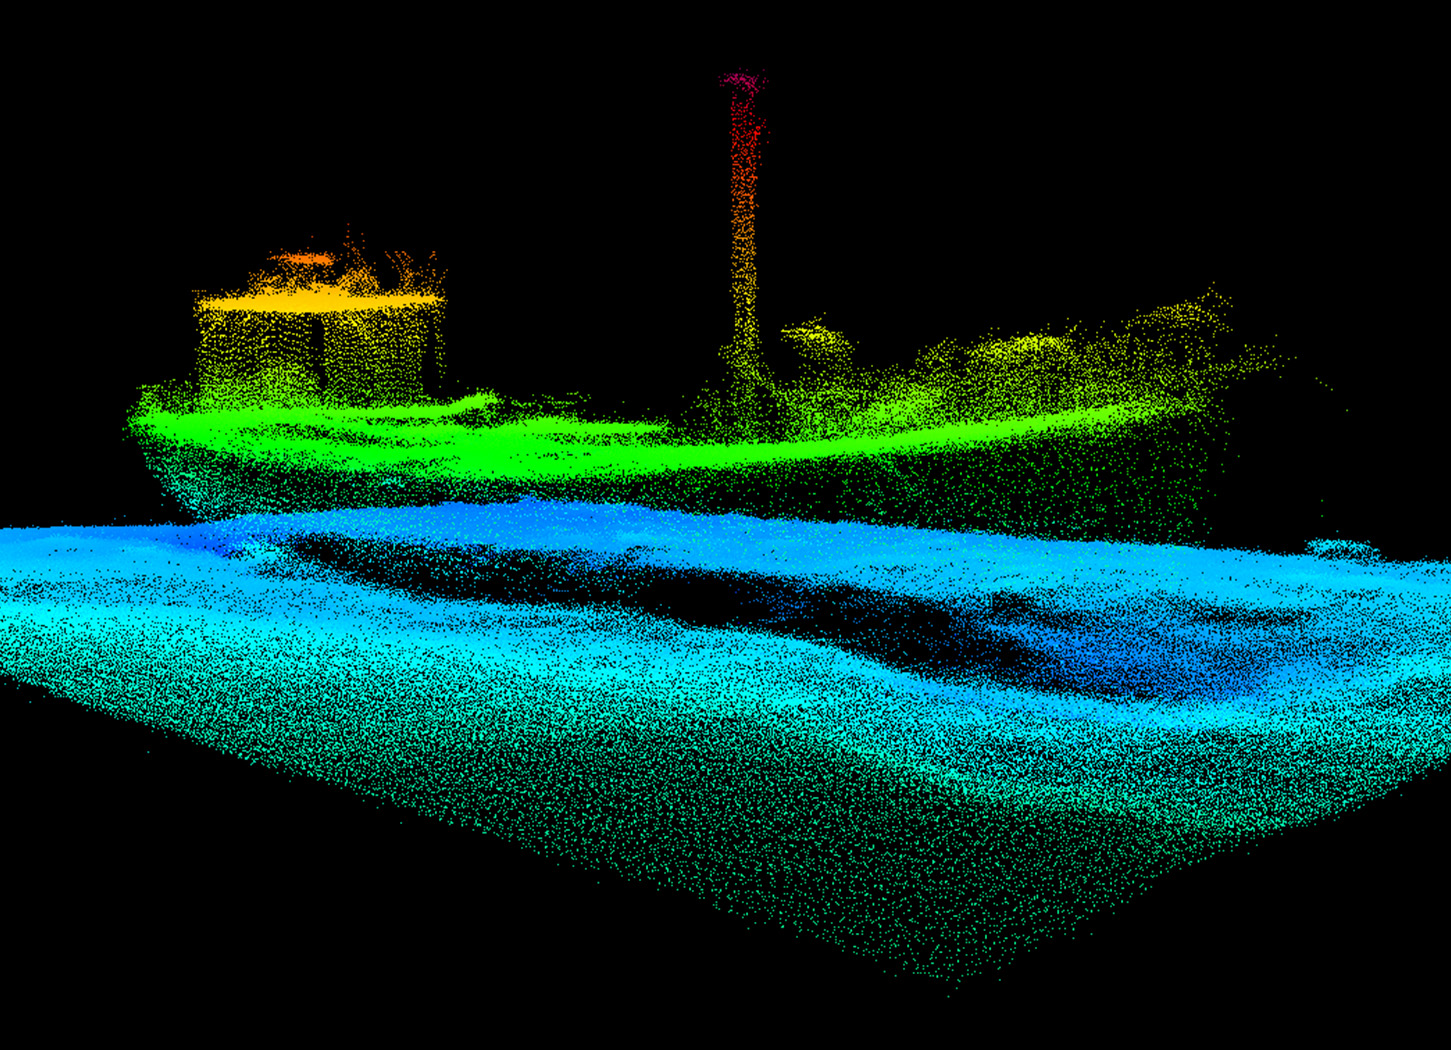
Getting the data is far easier these days. As Clarke puts it, you only have to go back around 120 years to be in a situation where measuring depth, for instance, was a matter of lowering a lead weight over the side of a ship and waiting until it hit the seabed. “There were various methods used to try and make that operation a lot easier and faster, but it was still a very slow way of doing things,” he says.
Today, global positioning systems (GPS) make the process of at least knowing where exactly you are far easier and more accurate, but Clarke says that the generic use of the term GPS doesn't reflect how the science of measurement has evolved in recent years. “GPS, developed by the United States, was only the first of many satellite-based positioning systems available globally,” he says.
“In the meantime, lots of other systems have come online. Russia, China, India, Japan and Europe now have satellite constellations that help us use our satellite receivers to get a precise point position on the Earth's surface. Today we've got what we call GNSS: Global Navigation Satellite Systems.”
There are other issues to deal with. Measuring the seabed isn’t just about knowing where you are on the surface, it is also about understanding what lies beneath. Echo sound technology has made that infinitely easier, faster and more accurate – and progressively so over time. But even today, the collected data must be adjusted to take account of the tide and movement of the boat from which the data is taken.
“It's simple mathematics, but you need to know the height of tide above a datum for every depth measurement,” says Clarke. “Generally, we use something called a tide gauge, which has to be installed and if it's on the coast, we use land surveying techniques for doing that – such as levelling to a benchmark that has a known height difference from the datum.”
“Not even a quarter of the oceans have been mapped” Robert Clarke, United Kingdom Hydrographic Office (UKHO)
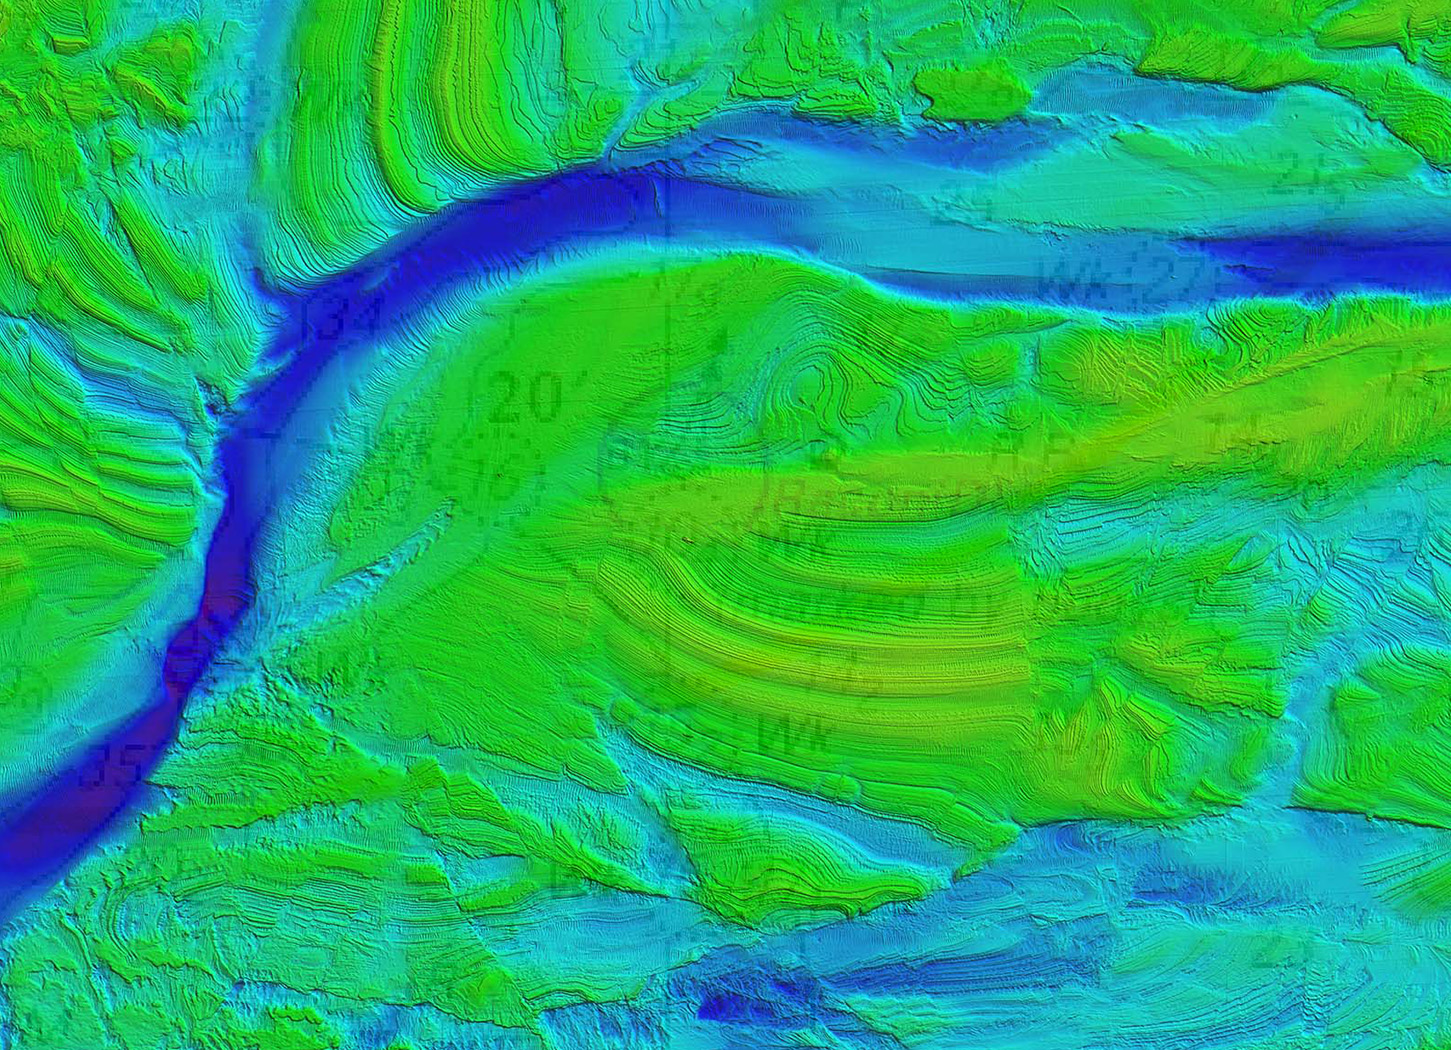
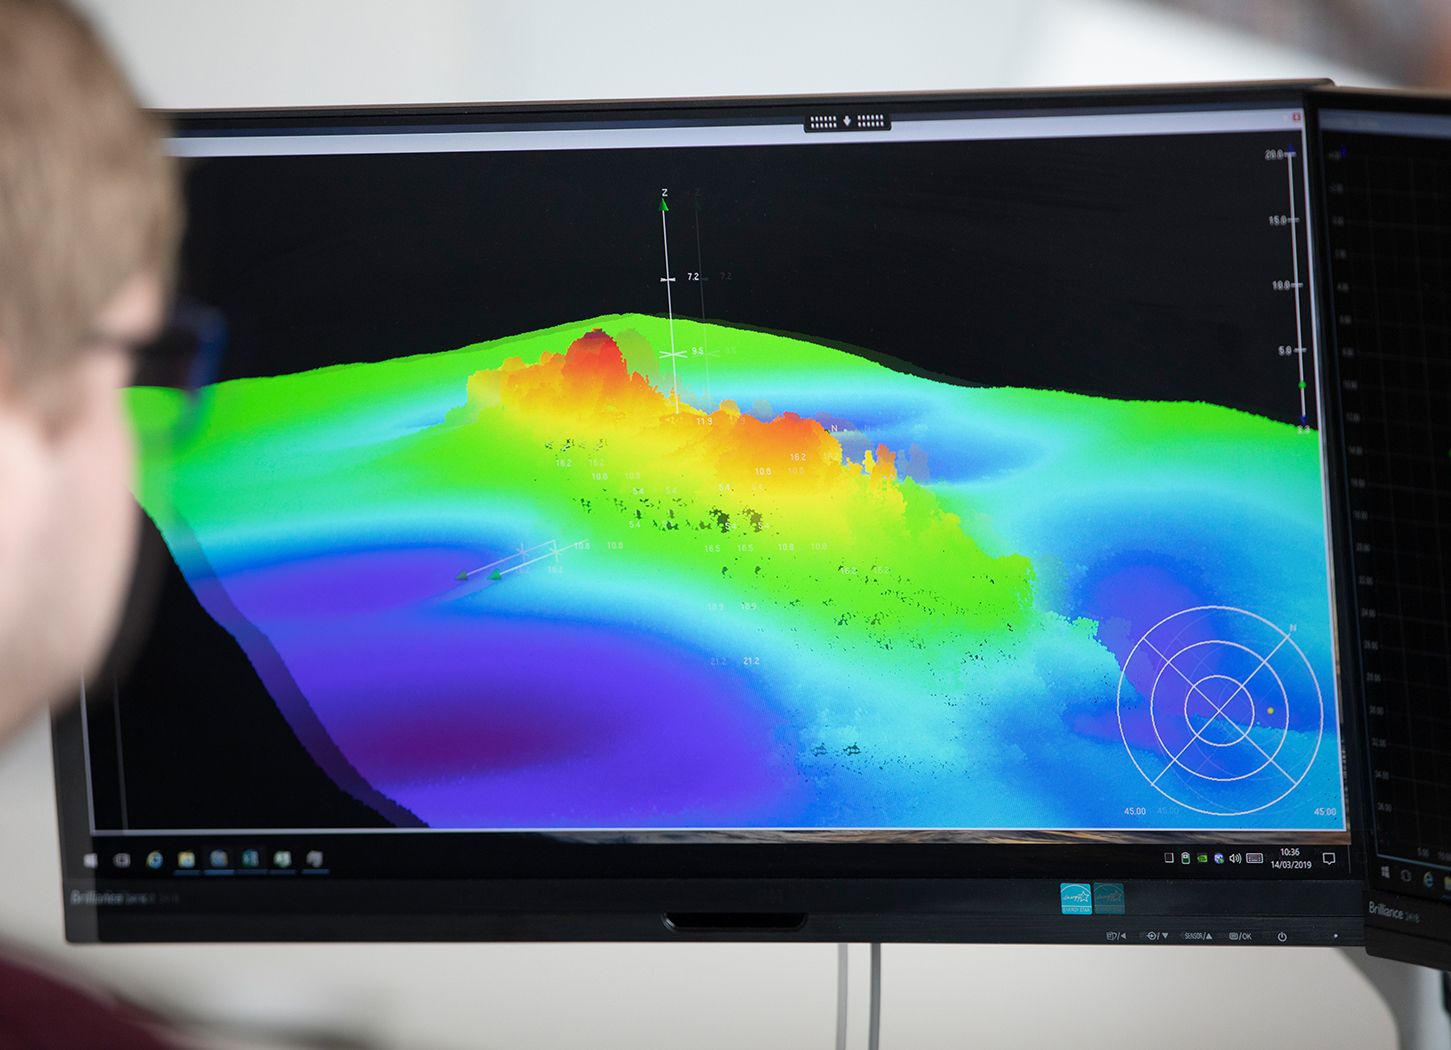
There are still legacy charts in circulation that relied in their execution on far less accurate measurements. As a result, part of the UKHO’s job today is correcting what we thought we knew. “In the days before electronic positioning aids, determining the position of a feature could be challenging. Particularly when relying on handheld instruments such as the sextant,” says Clarke.
“When we go back to those places today with modern measuring techniques, we can sometimes see that those early surveyors were probably not that far out in their calculations. But sometimes we discover that small features such as rocks, reefs and wrecks are not in the position that early surveyors had calculated. Hydrography is an ongoing science because what was measured 100 years ago needs to be remeasured today, so we can determine the exact position of any navigational hazards.”
Sometimes, this can be a matter of life and death. The Falklands War is a case in point. “When the Royal Navy had to go down to the Falklands, they had to do a lot of quick checking of the charts,” says Clarke. “They went out and did some more measurements to make sure it was safe to enter those areas. Hydrographic data comes from many sources; at times of war, you check it because it may have been deliberately falsified by an enemy who hopes you'll run into a rock.”
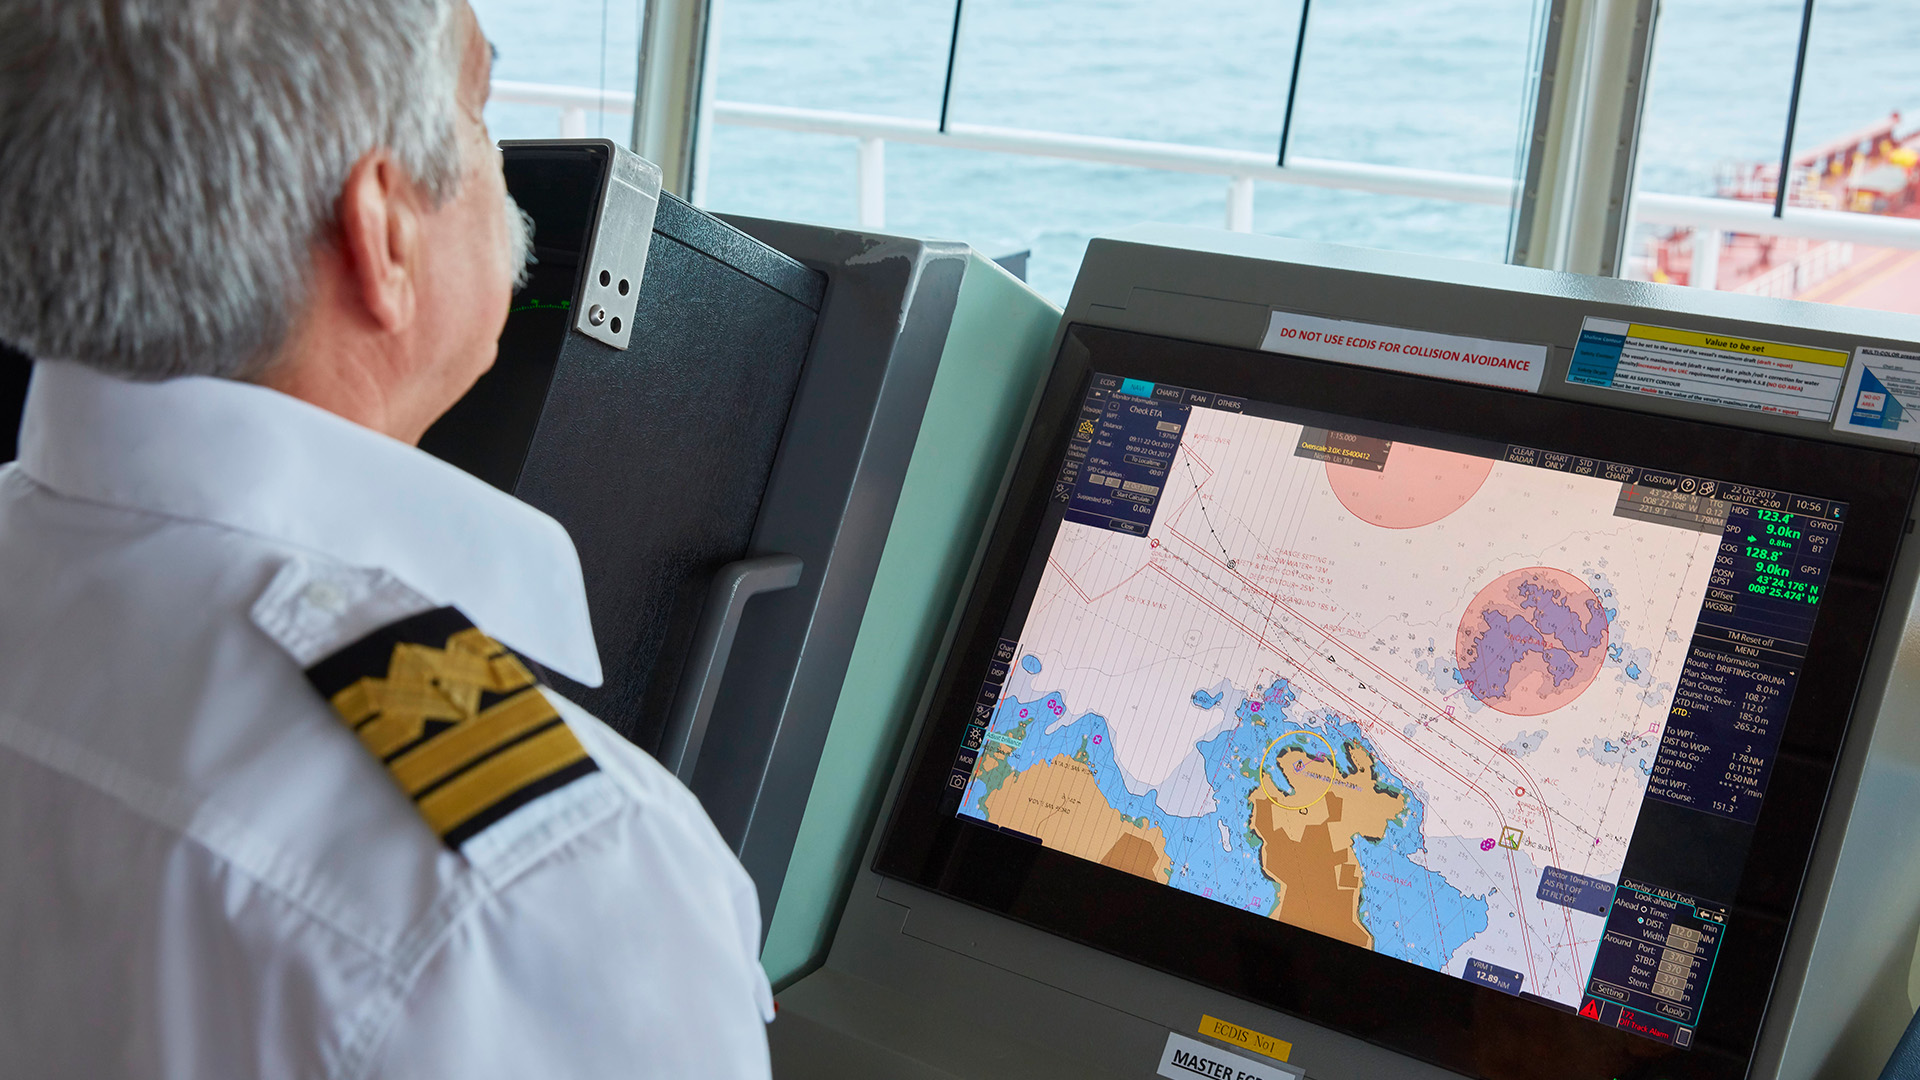
That points to an element of the purpose of hydrography that is, necessarily, clouded in secrecy. And sits within a separate department altogether. “We maintain strong links with the Royal Navy because we are still an organisation that has a strategic role in providing in-depth information to them,” says Clarke
“They do some of their own surveying that goes to particular departments that wouldn't produce charts for the general public.” And wouldn’t be talking to journalists? “That's right. We're not the only ones that value this data.”
Obviously, that is intriguing. But so too is the answer to another question: just how much of the seabed has been accurately mapped? “Roughly a quarter of the oceans have been mapped,” Clarke replies. “We've got a huge way to go when you think 71% of the earth's surface is covered by water.”
MODUS
Mark Williams 26 February 2024