Illustrations by Shaivalini Kumar
India is expected to overtake China as the most populous country on the planet by 2027, if not even sooner. It's growing at a phenomenal rate – the population has almost doubled in 40 years, from 698m in 1980 to 1.36bn in 2019. Its most highly populated state, Uttar Pradesh in the north of the country, has nearly 200m inhabitants alone, which would make it the 8th largest country in the world.
When a country is growing that quickly, infrastructure must be built at speed to keep up. However, the construction industry is picking up pace again after a huge wave of COVID-19 earlier this year brought the country to a standstill.
But just how big is India and how do some of its socio-economic statistics weigh up against other countries around the world? Modus decided to take a look at the numbers.
Population of India
Mumbai is the centre of India’s economy and is expected to have a population of 40m by 2050, which would make it the biggest city on Earth.
“With more than 50 new residents arriving in Mumbai per hour, accommodating the pace of growth is putting pressure on a city with constrained land supply and soaring congestion,” says The London School of Economics research programme Urban Age.
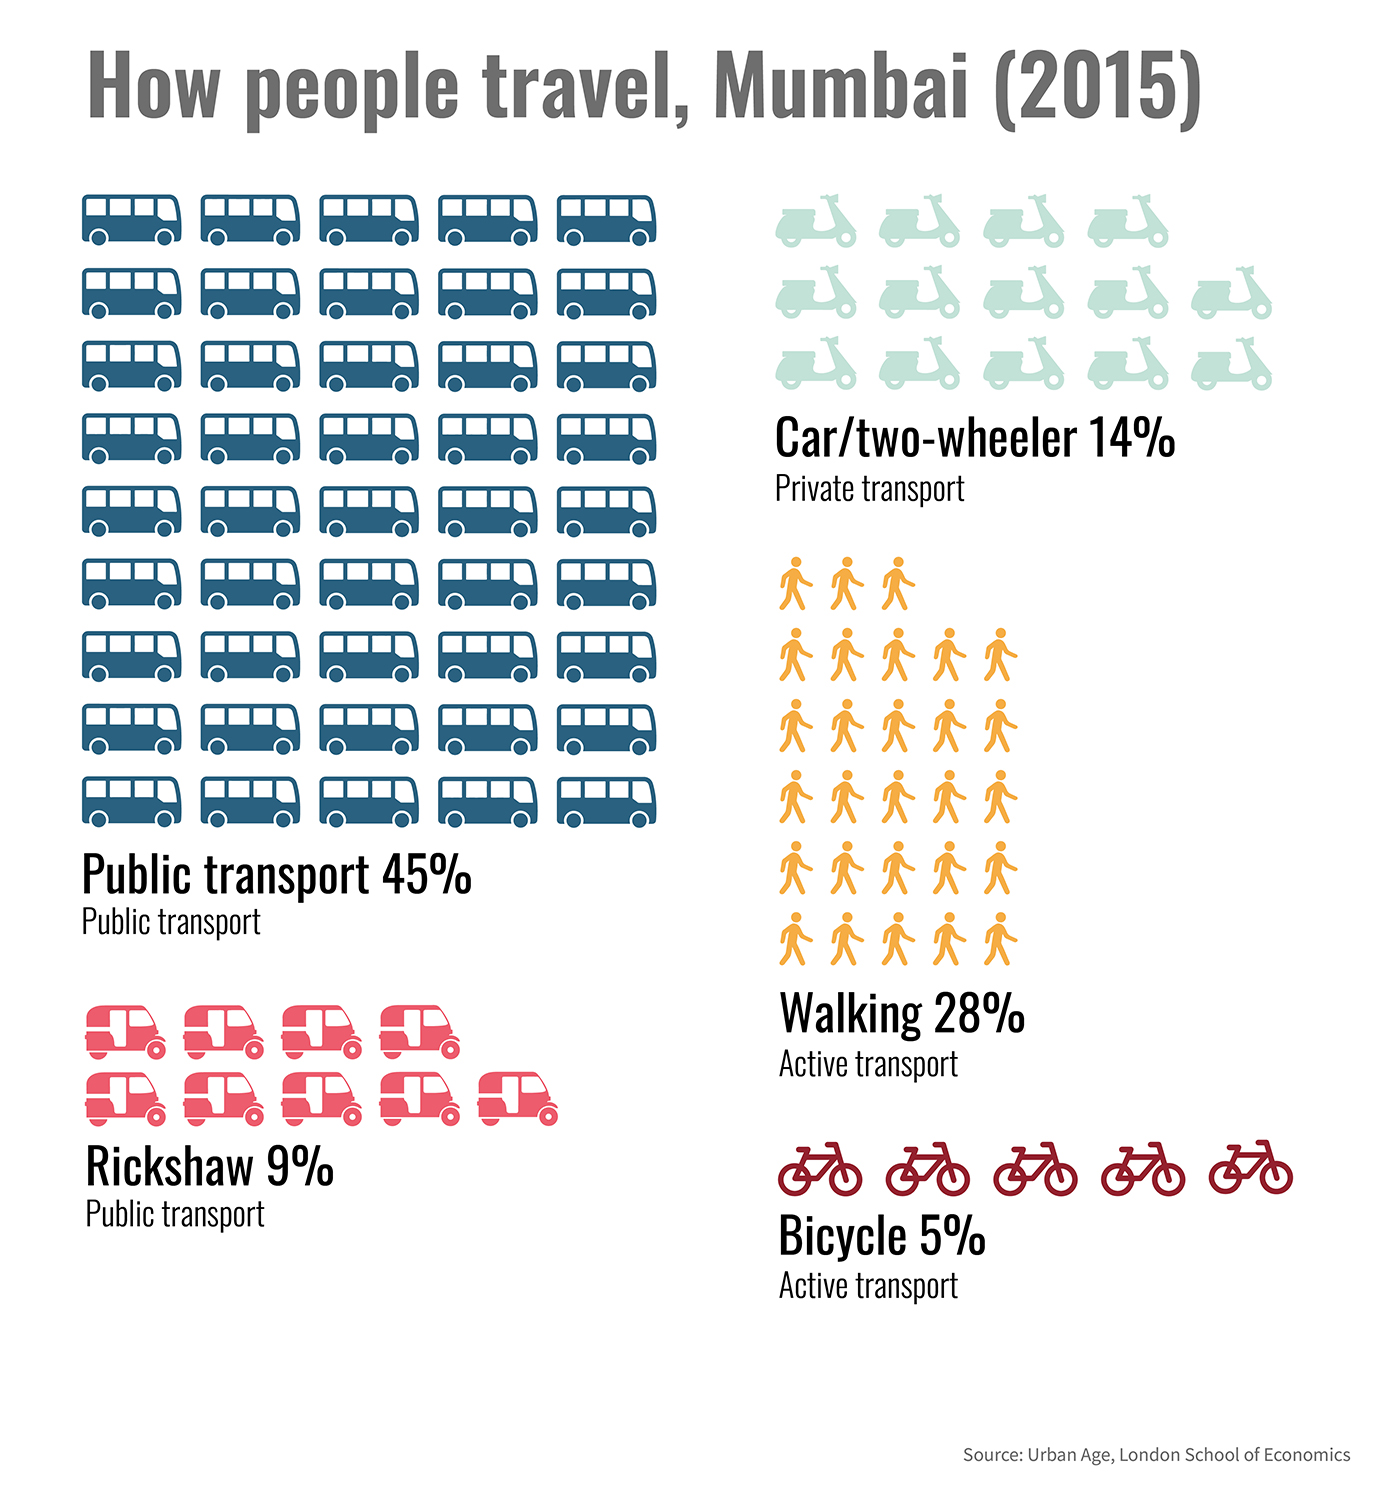
“While Mumbai has expanded significantly, its density levels have barely dropped. With over half the population living in slums and the majority of daily trips made on foot, bicycle or public transport, Mumbai magnifies the conflicts of contemporary urbanisation."
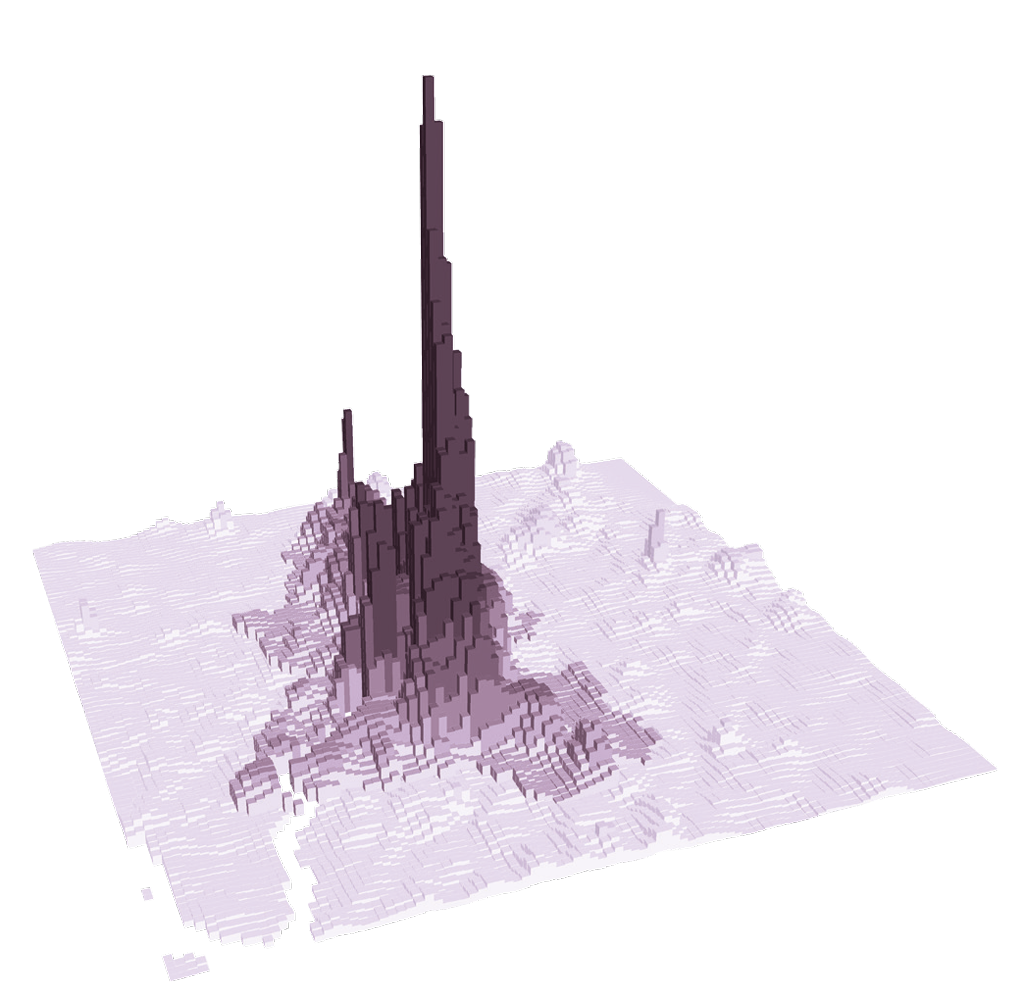
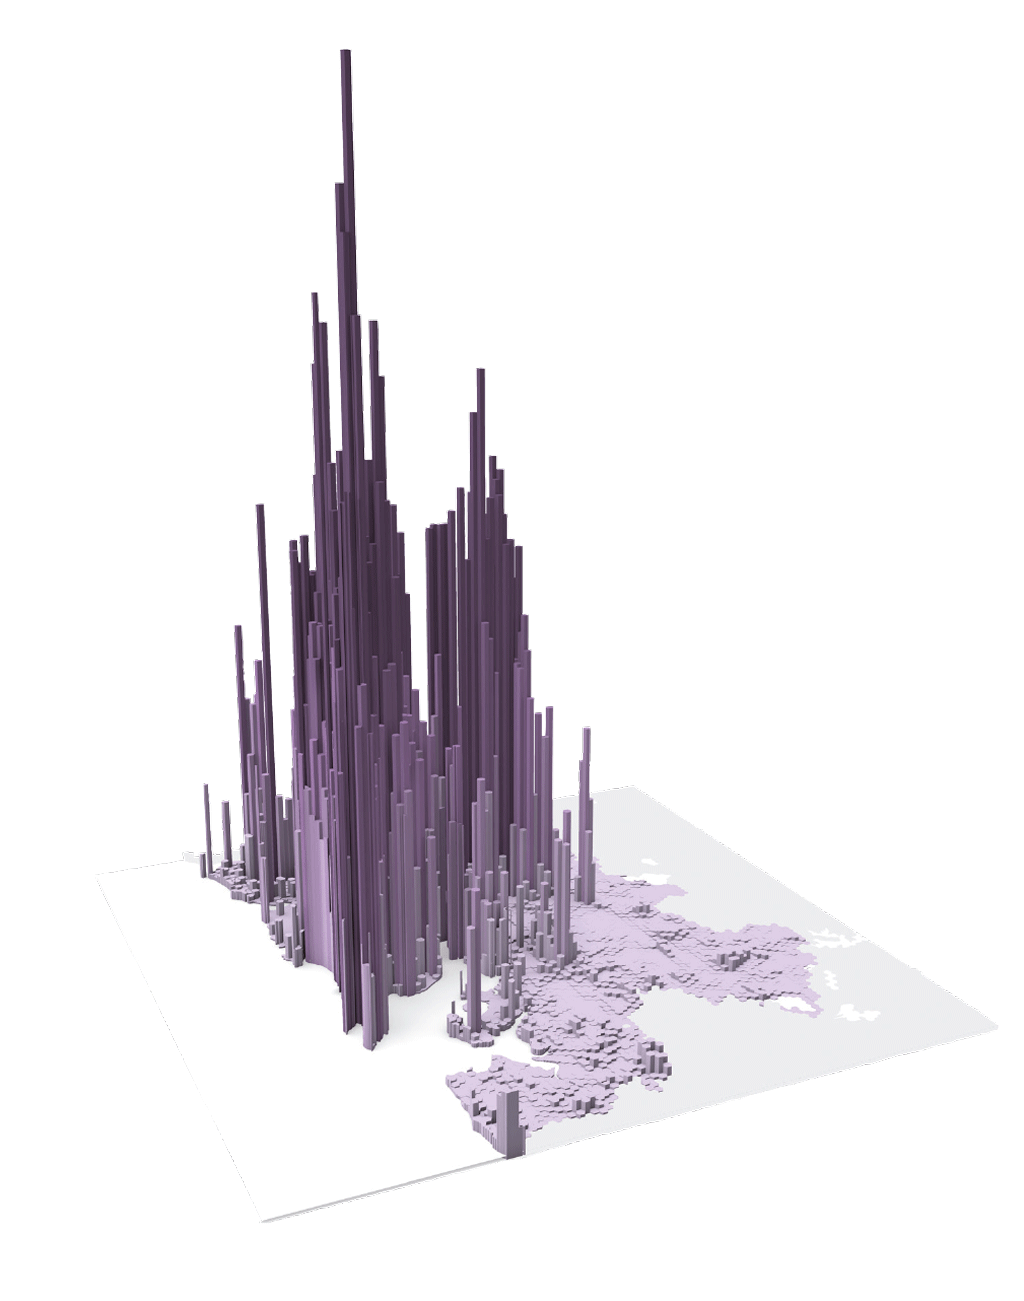
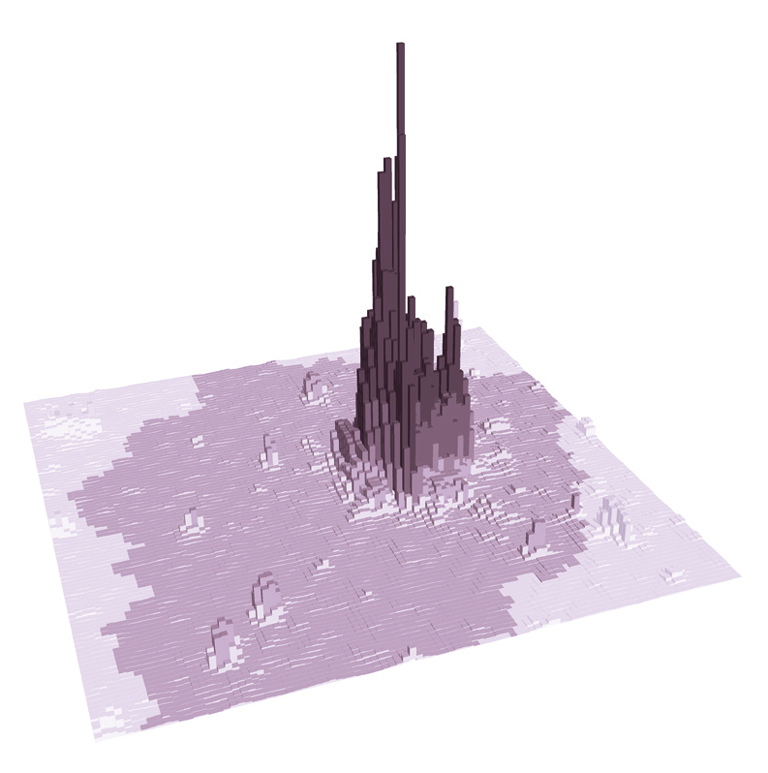
Residential population densities of Kolkata, Mumbai, and Bengaluru
Kolkata, Mumbai and Bengaluru are three of India’s most highly populated cities. At the time of the 2011 census, Kolkata had 4.4m inhabitants, Bengaluru had 8.4m and Mumbai 12.4m (although it’s now thought to be closer to 20m).
These residential density maps show how the population is spread throughout each city.
Image credits: Urban Age, LSE Cities
Demographics
The first graph shows that India has a much younger population on average than the US and UK, where the longer life expectancy is highlighted in a larger percentage of the population being 65 or older. The second graph shows the literacy rate of India by age group, which decreases significantly for the older population, especially those between 70-74 years old.

The median age in India is 28, compared to 40 in the US

Fertility rate in 2018 was 2.2 births per woman, down from 5.91 in 1960
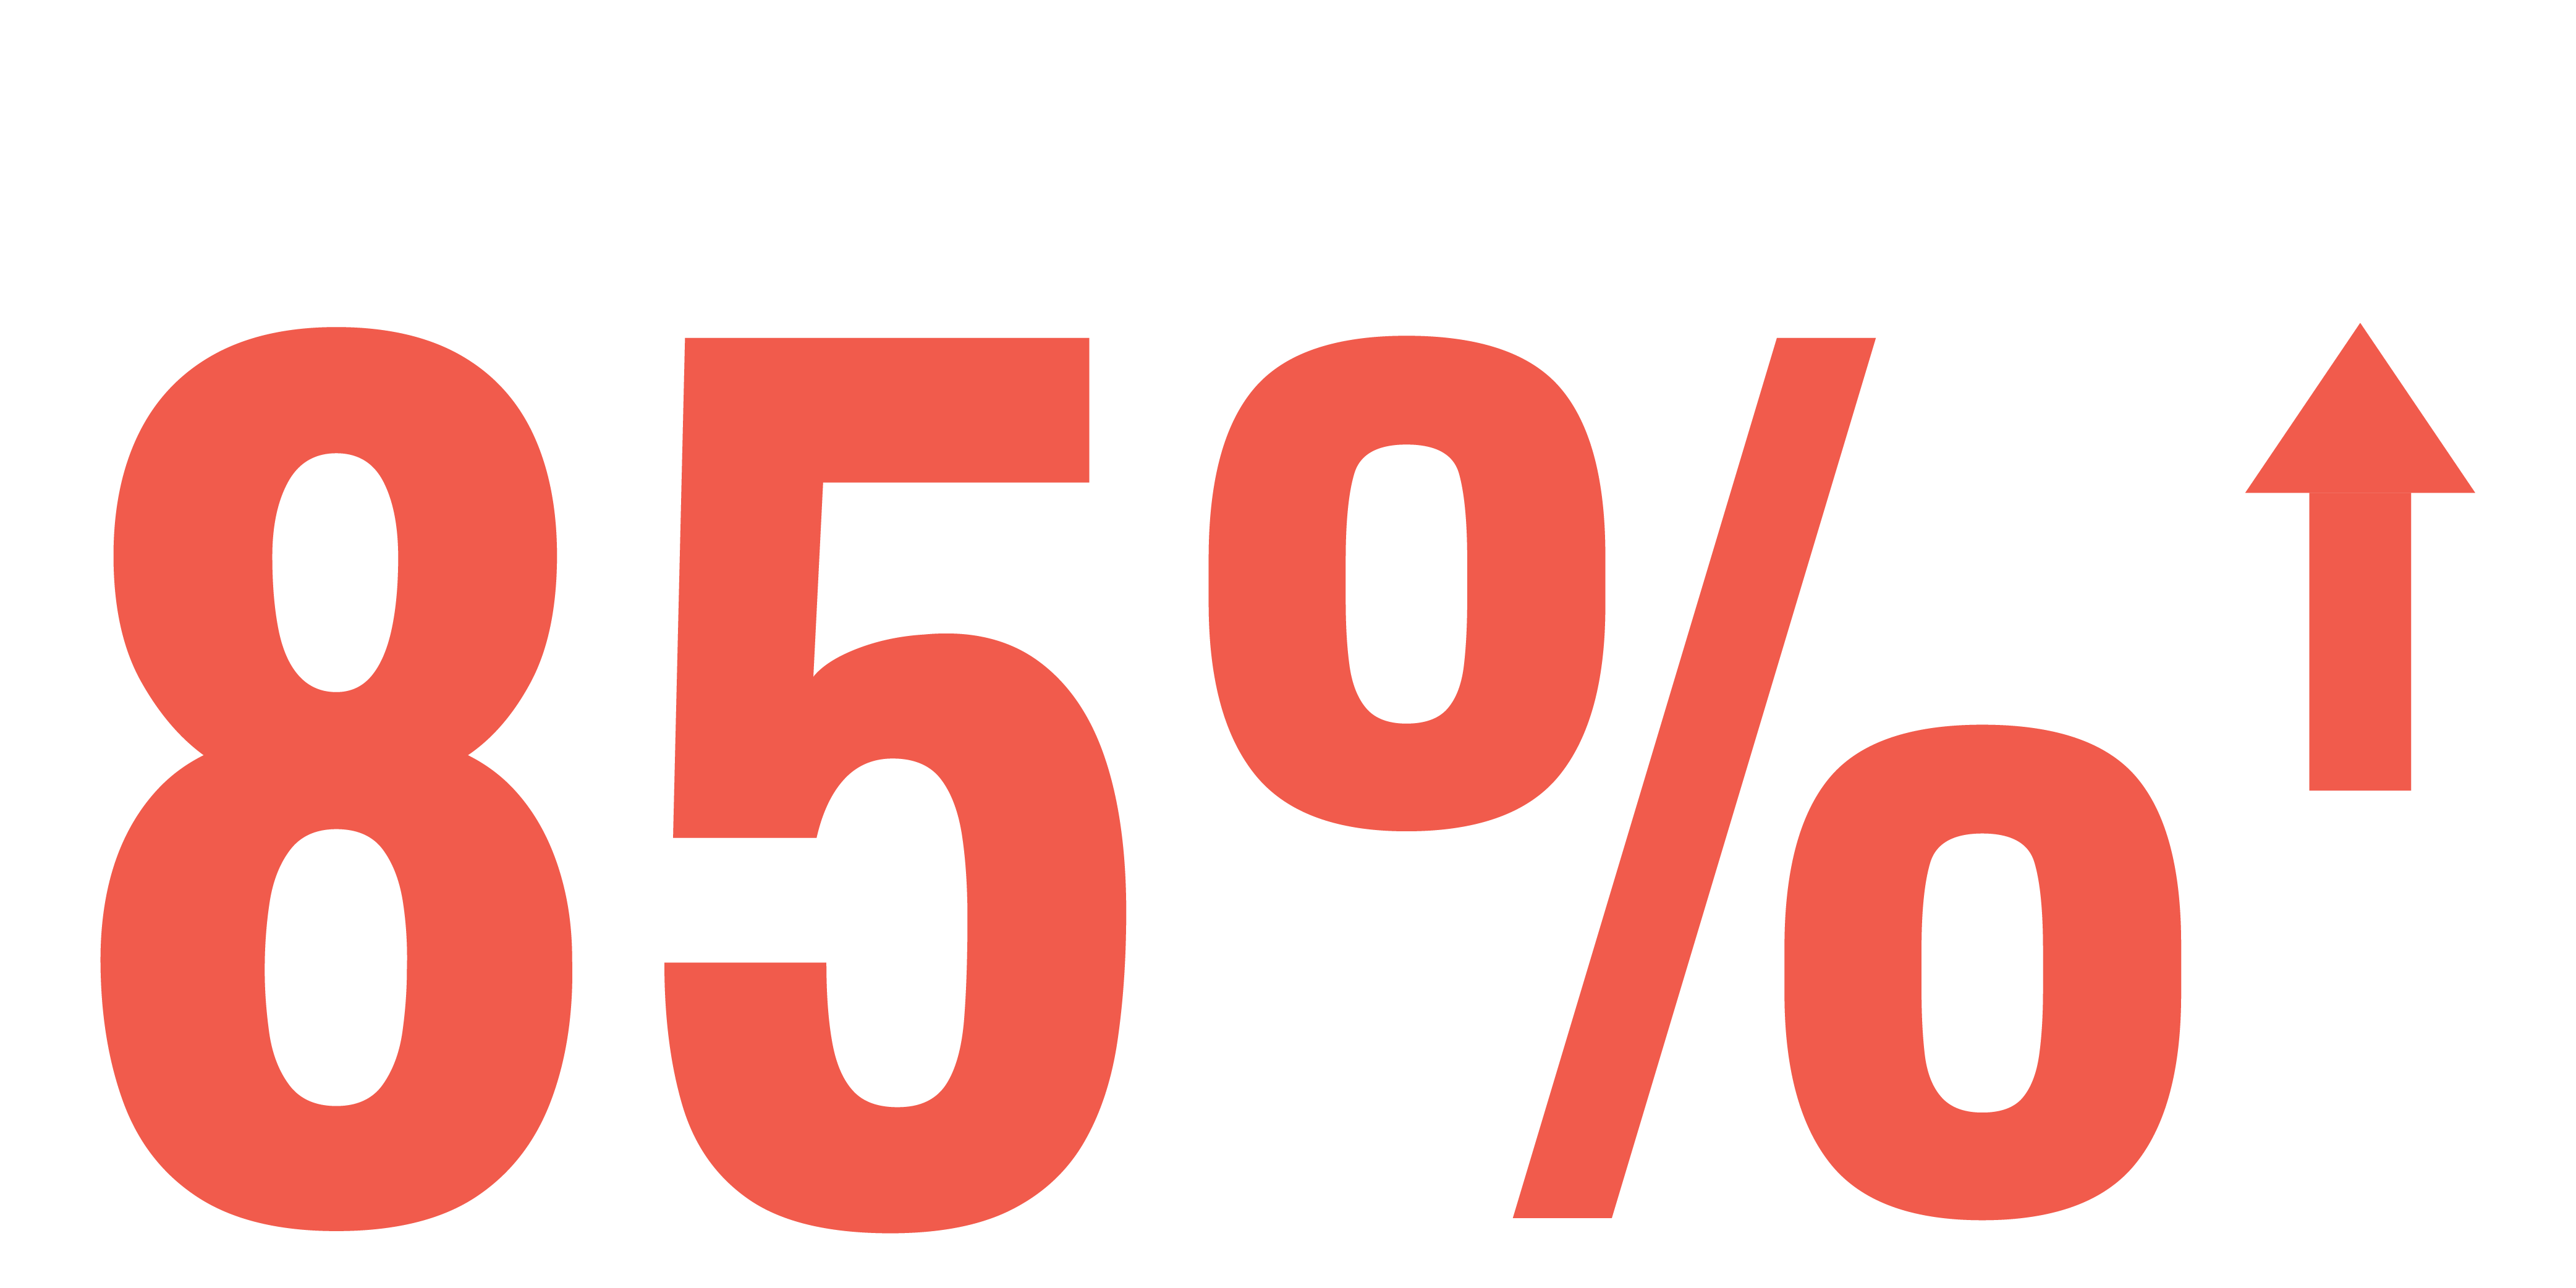
85% of the population have access to electricity now, as opposed to 43% in 1990
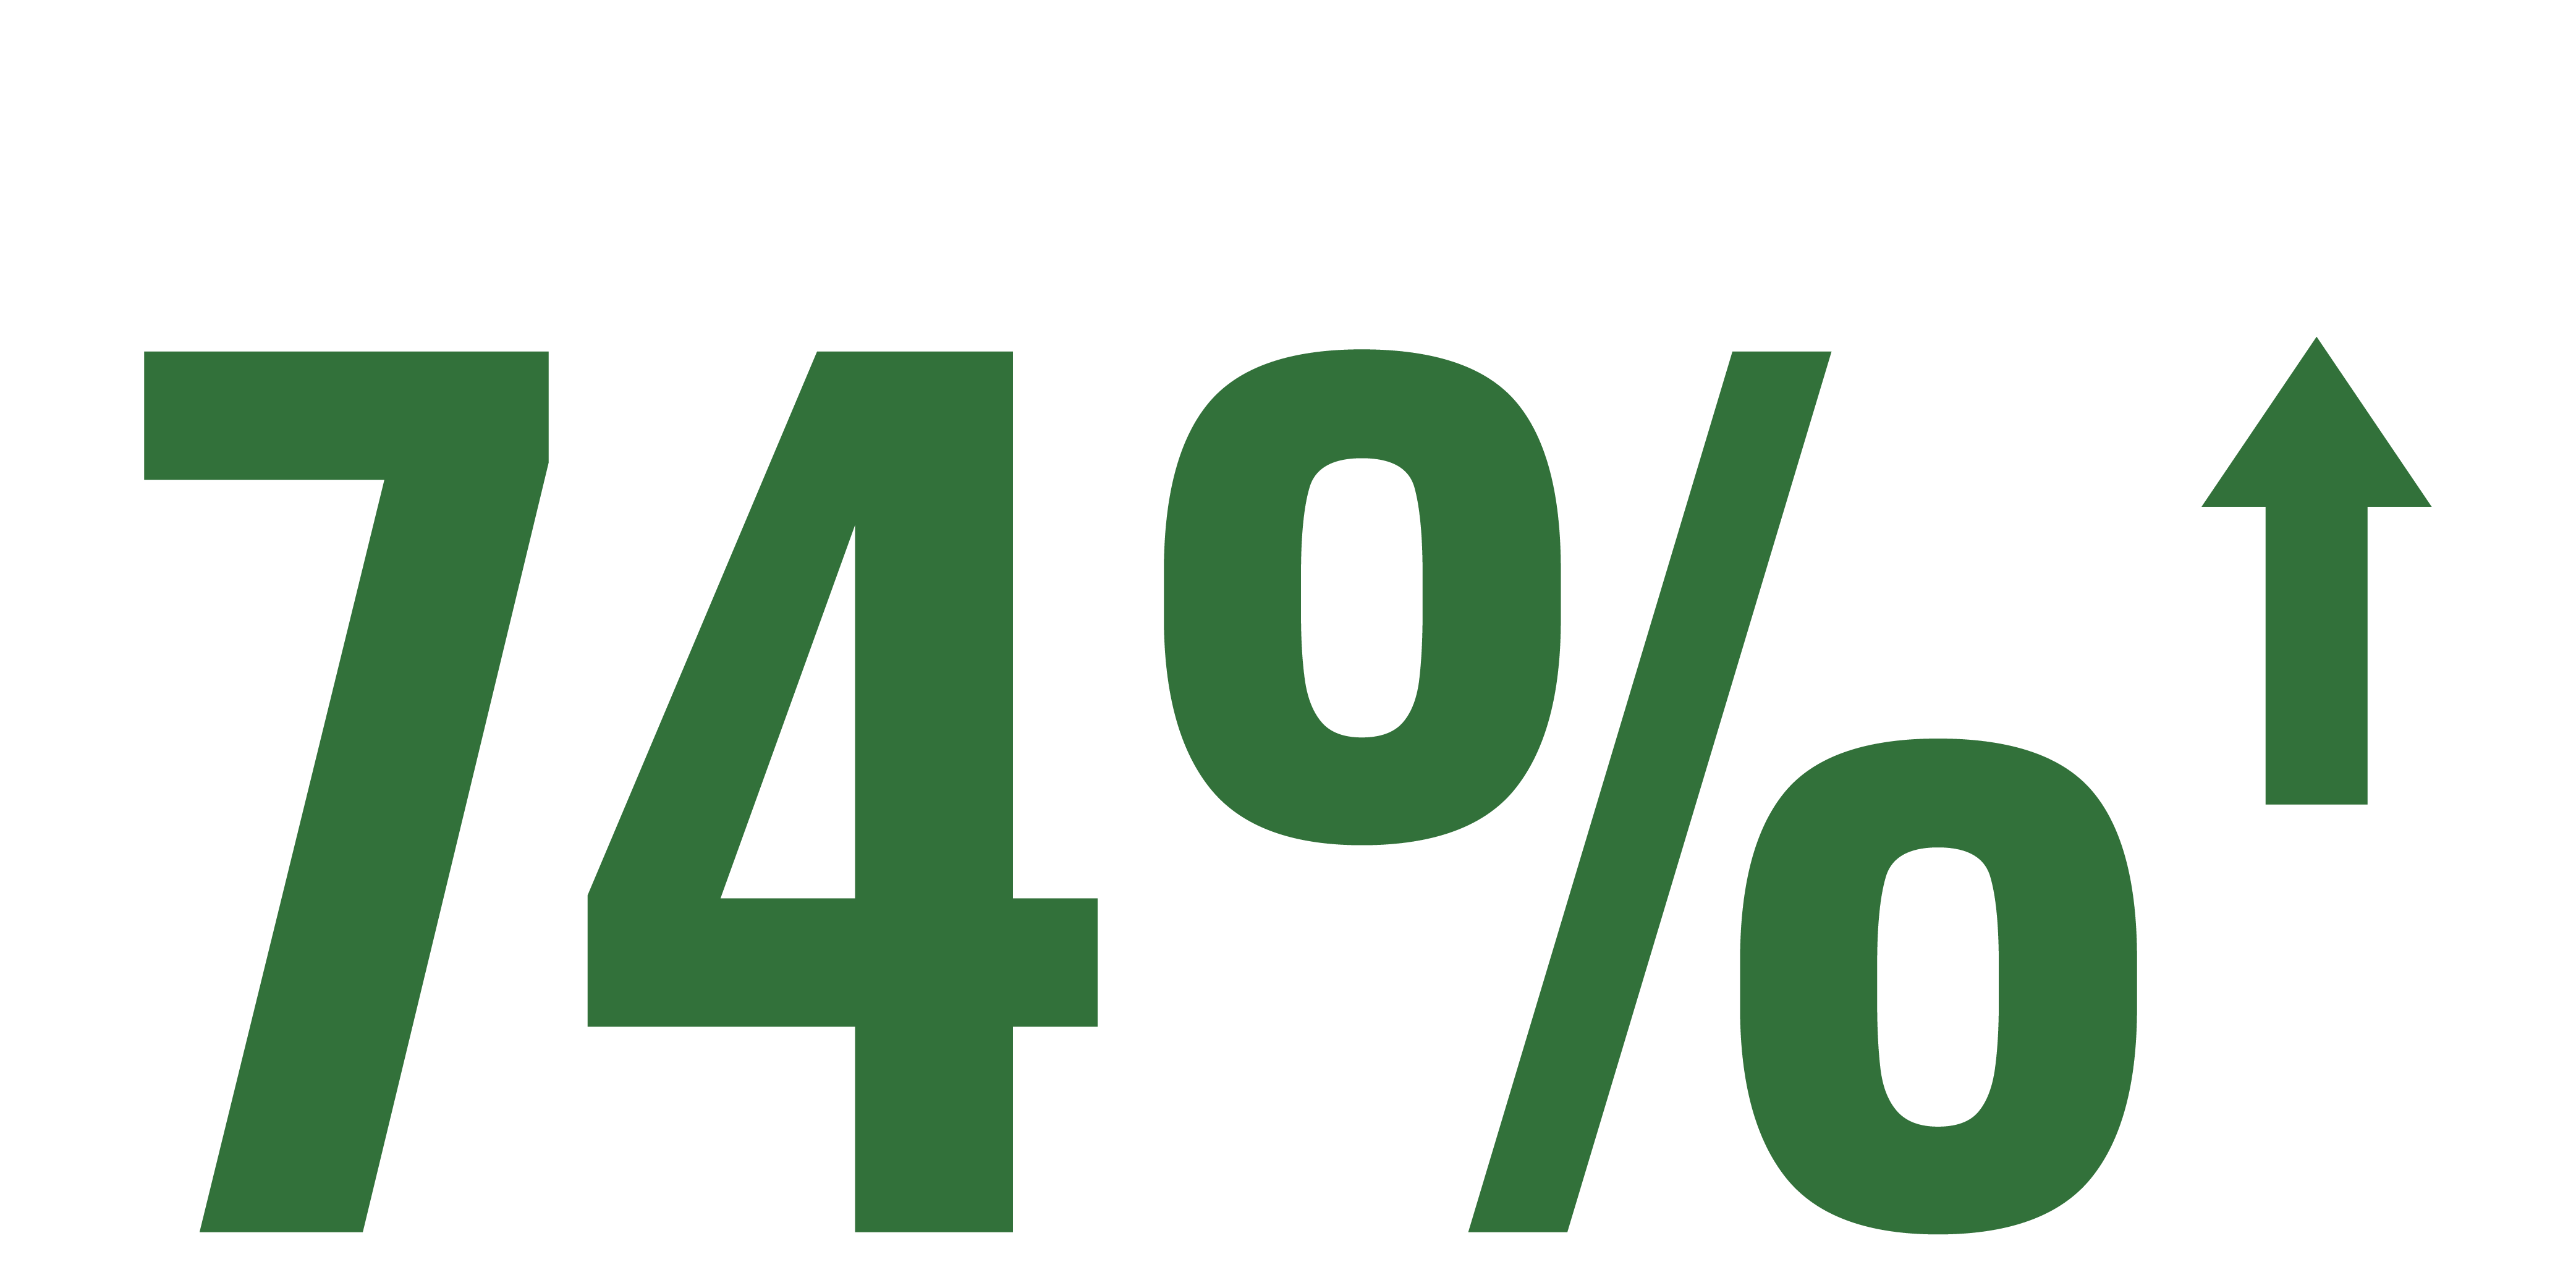
India’s literacy rate in 2018 was 74%, up from 43% in 1981
Economy
These four graphs give a picture of the economy in India, showing GDP, growth of the middle classes and workforce.
For most of the 21st century, annual average GDP growth has been between 6% - 7%, making it the world’s fastest growing economy.
The average wage in India is 31,900 rupees a month ($434.75), although 25% of the population earn 16,900 ($230) or less. In the US the average wage is $7,891 per month and in China $2,441 per month.
Mobility
These ambient maps show the commuter densities of Mumbai and Delhi. Mumbai already has the second highest congestion level in the world, according to TomTom's worldwide traffic index, and with its population set to double by 2050 this could get a whole lot worse unless proper transport infrastructure is put in place.
Image credits: Urban Age, LSE Cities
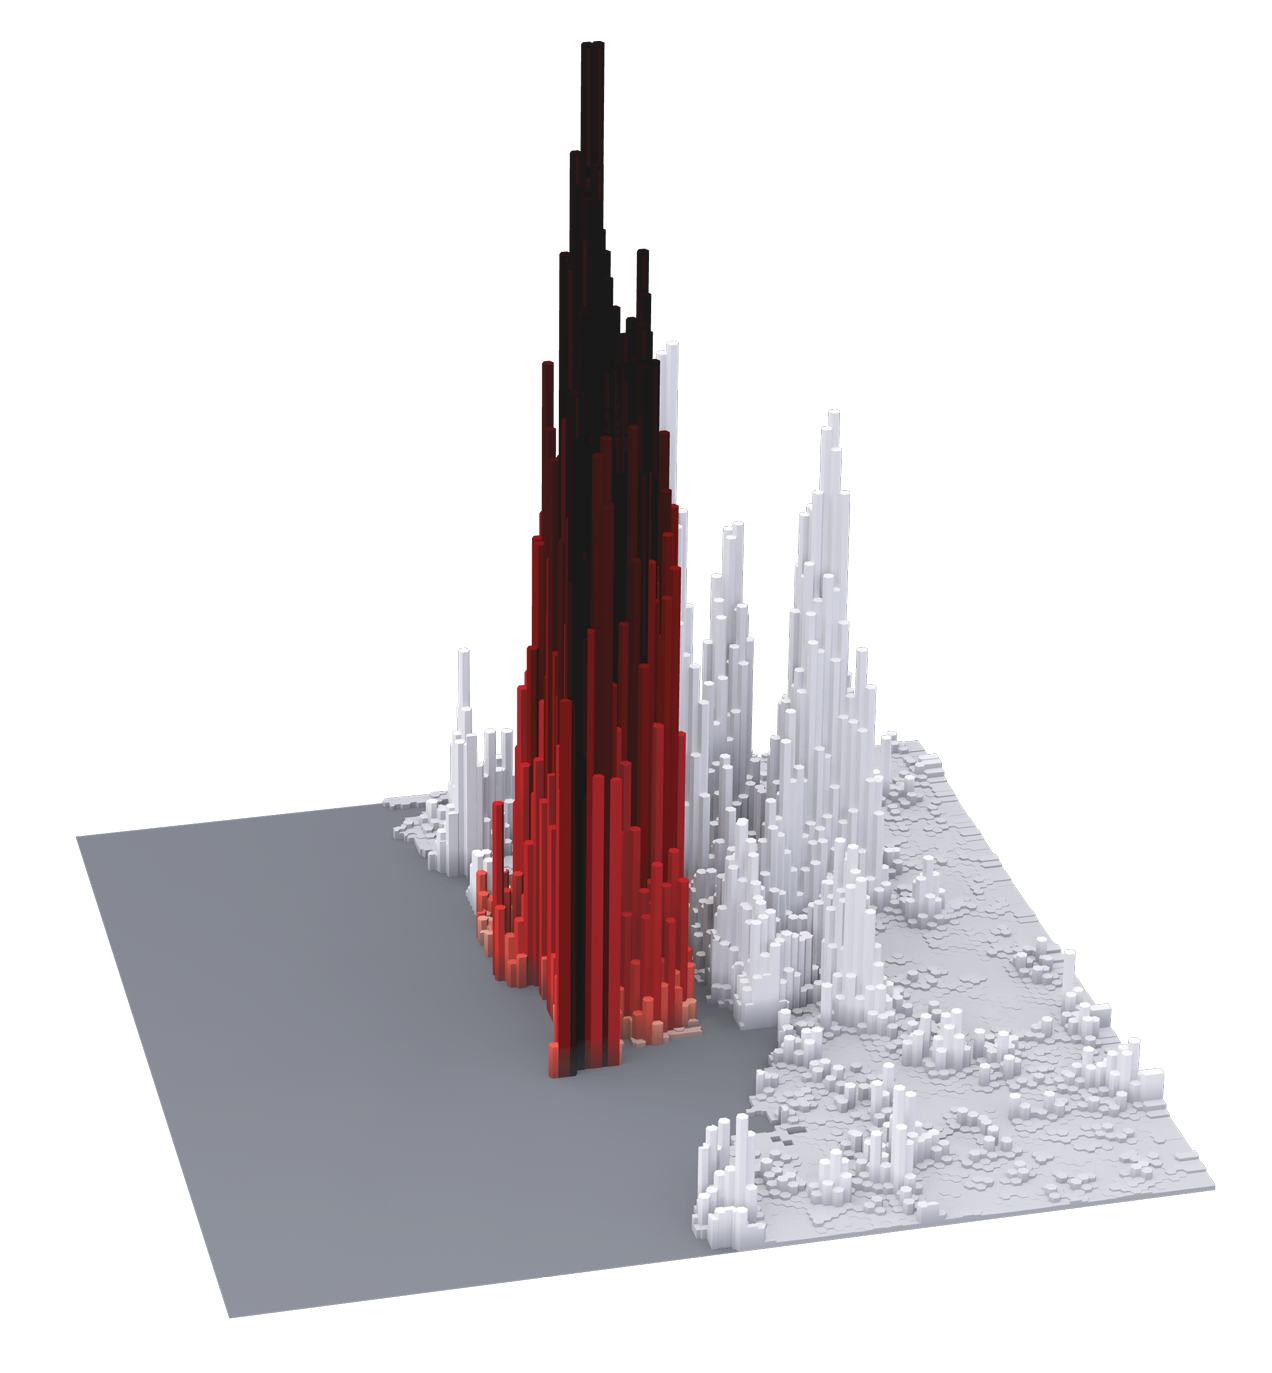
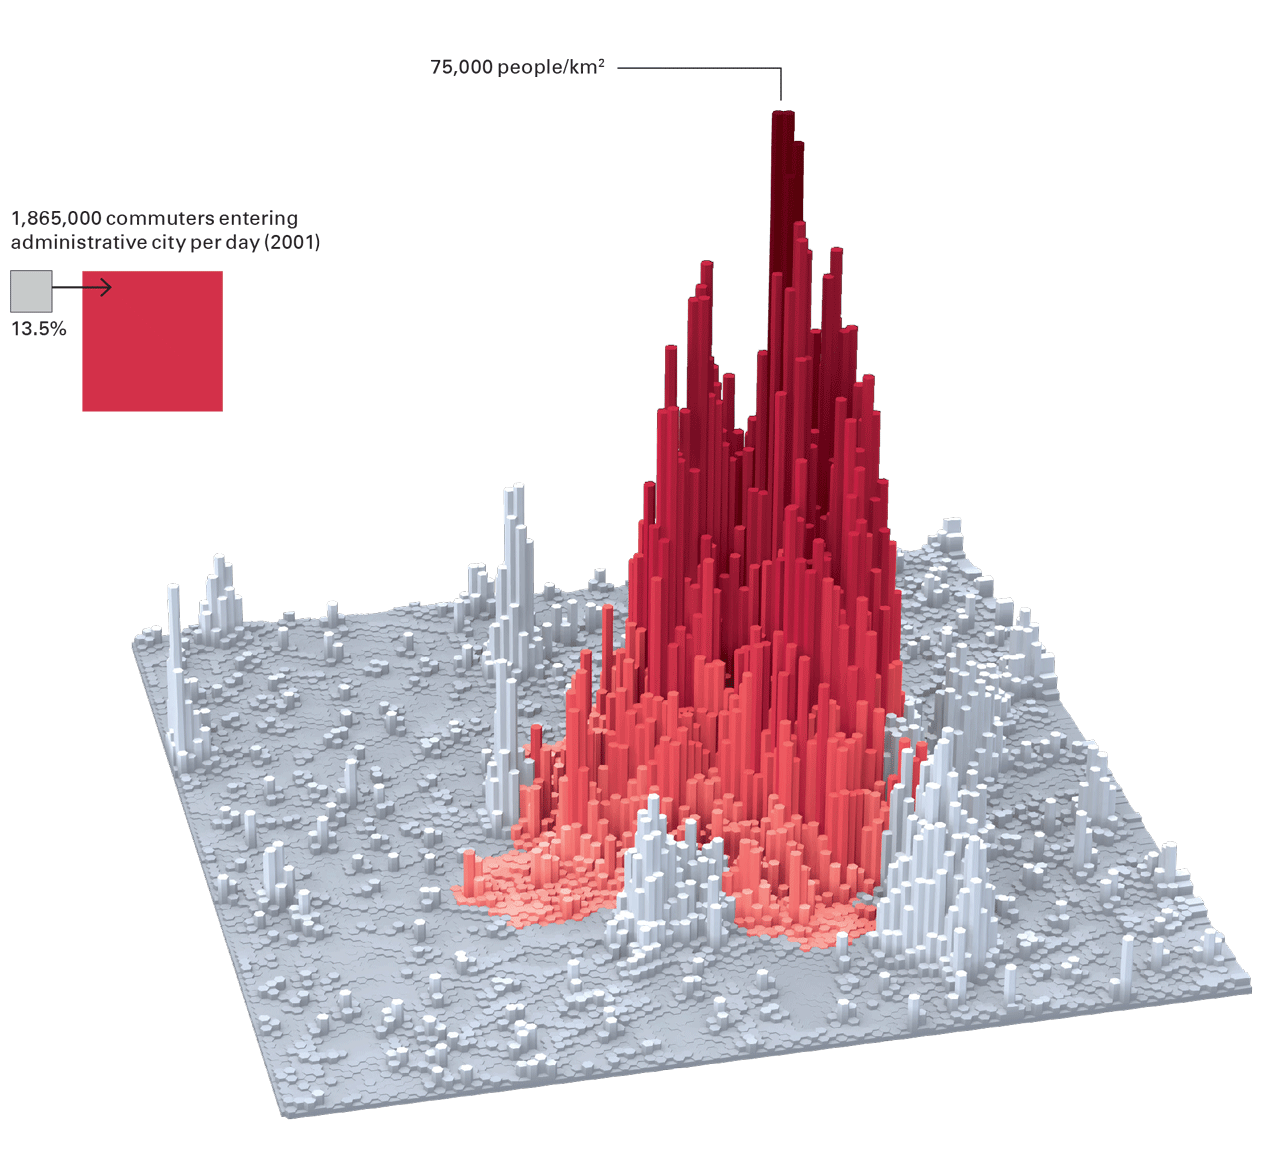
India has three of the world’s top 10 most congested cities on TomTom's worldwide traffic index – Mumbai, Bengaluru and New Dehli.
To travel by car from India's southernmost city of Thiruvananthapuram to its most northerly of Srinagar (3,700km) would take 66 hours according to Google Maps. That’s the equivalent distance of a European road trip from Lisbon, Portugal to Vilnius, Lithuania, but that journey would take only 37 hours due to better driving conditions and less congestion on the roads.
Indians spend more time commuting than most other countries – around two hours or 7% of their day just getting to and from work.
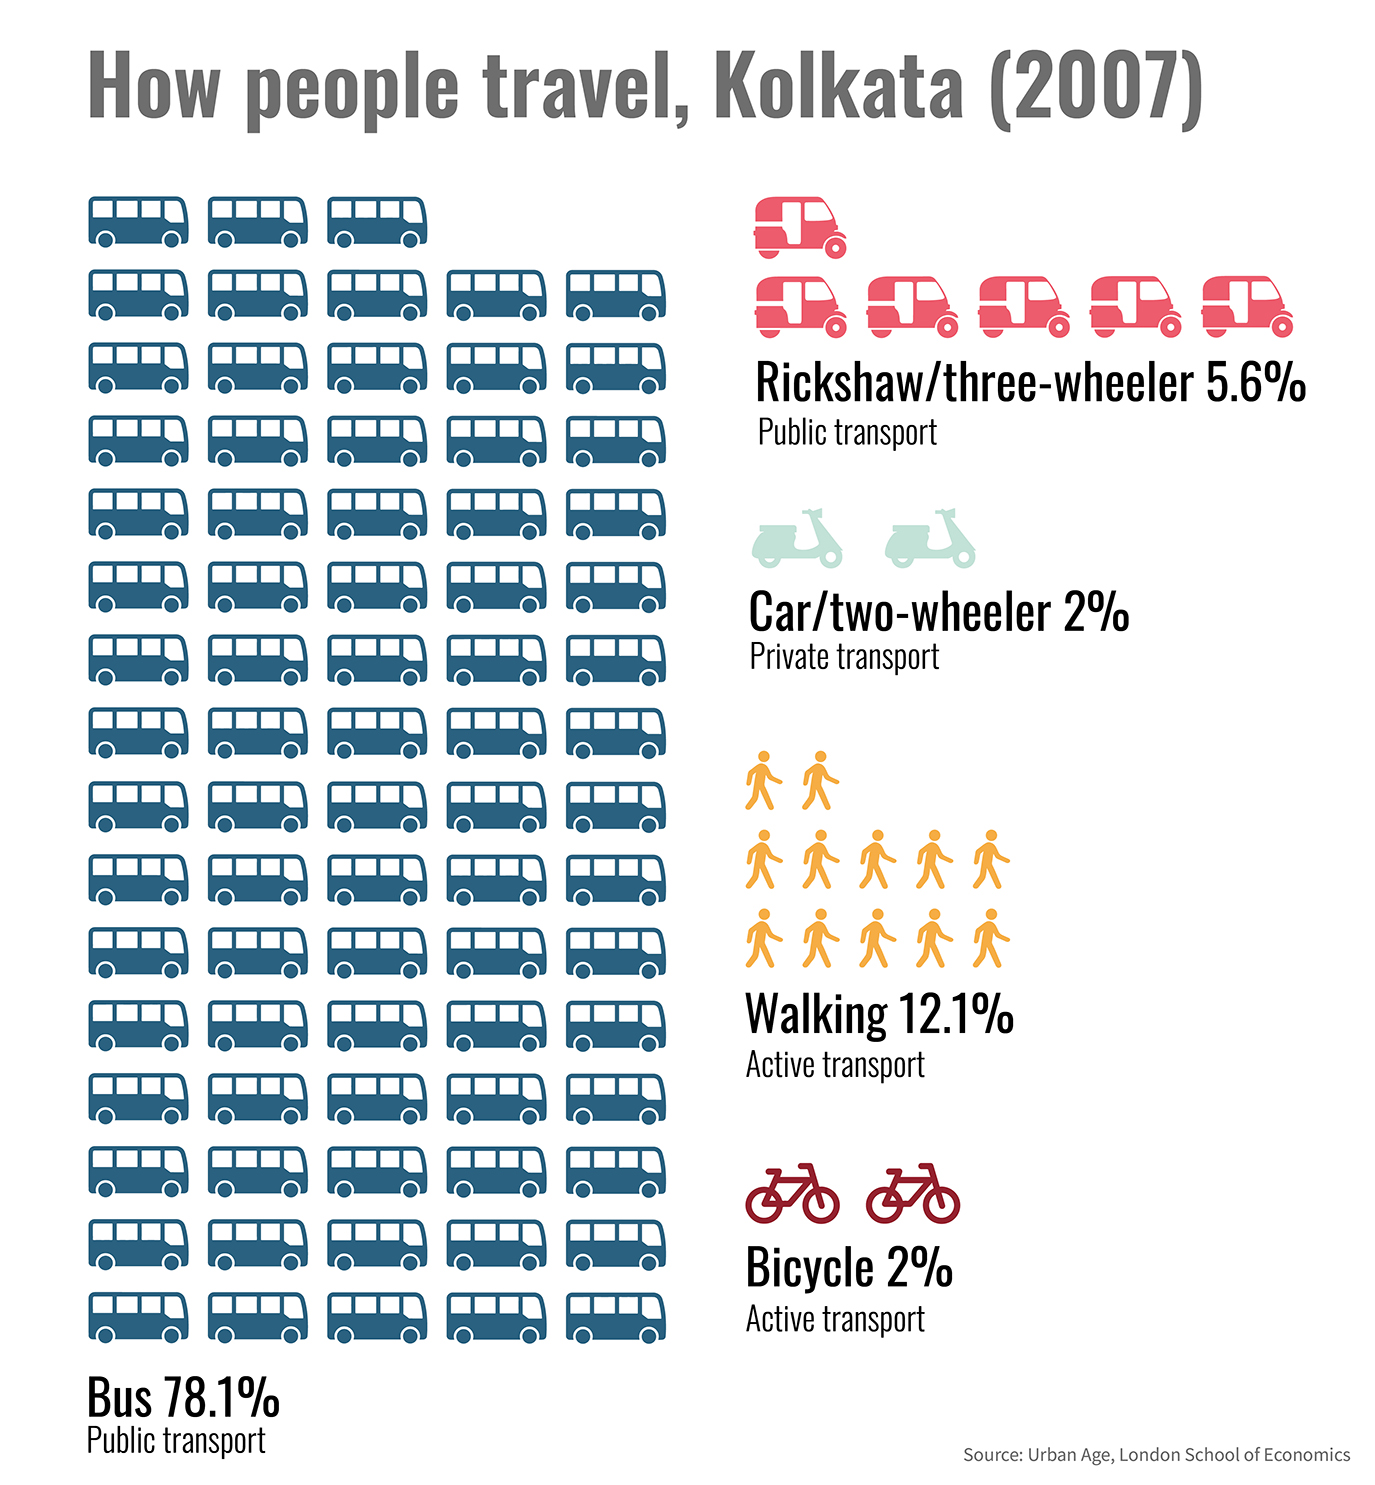
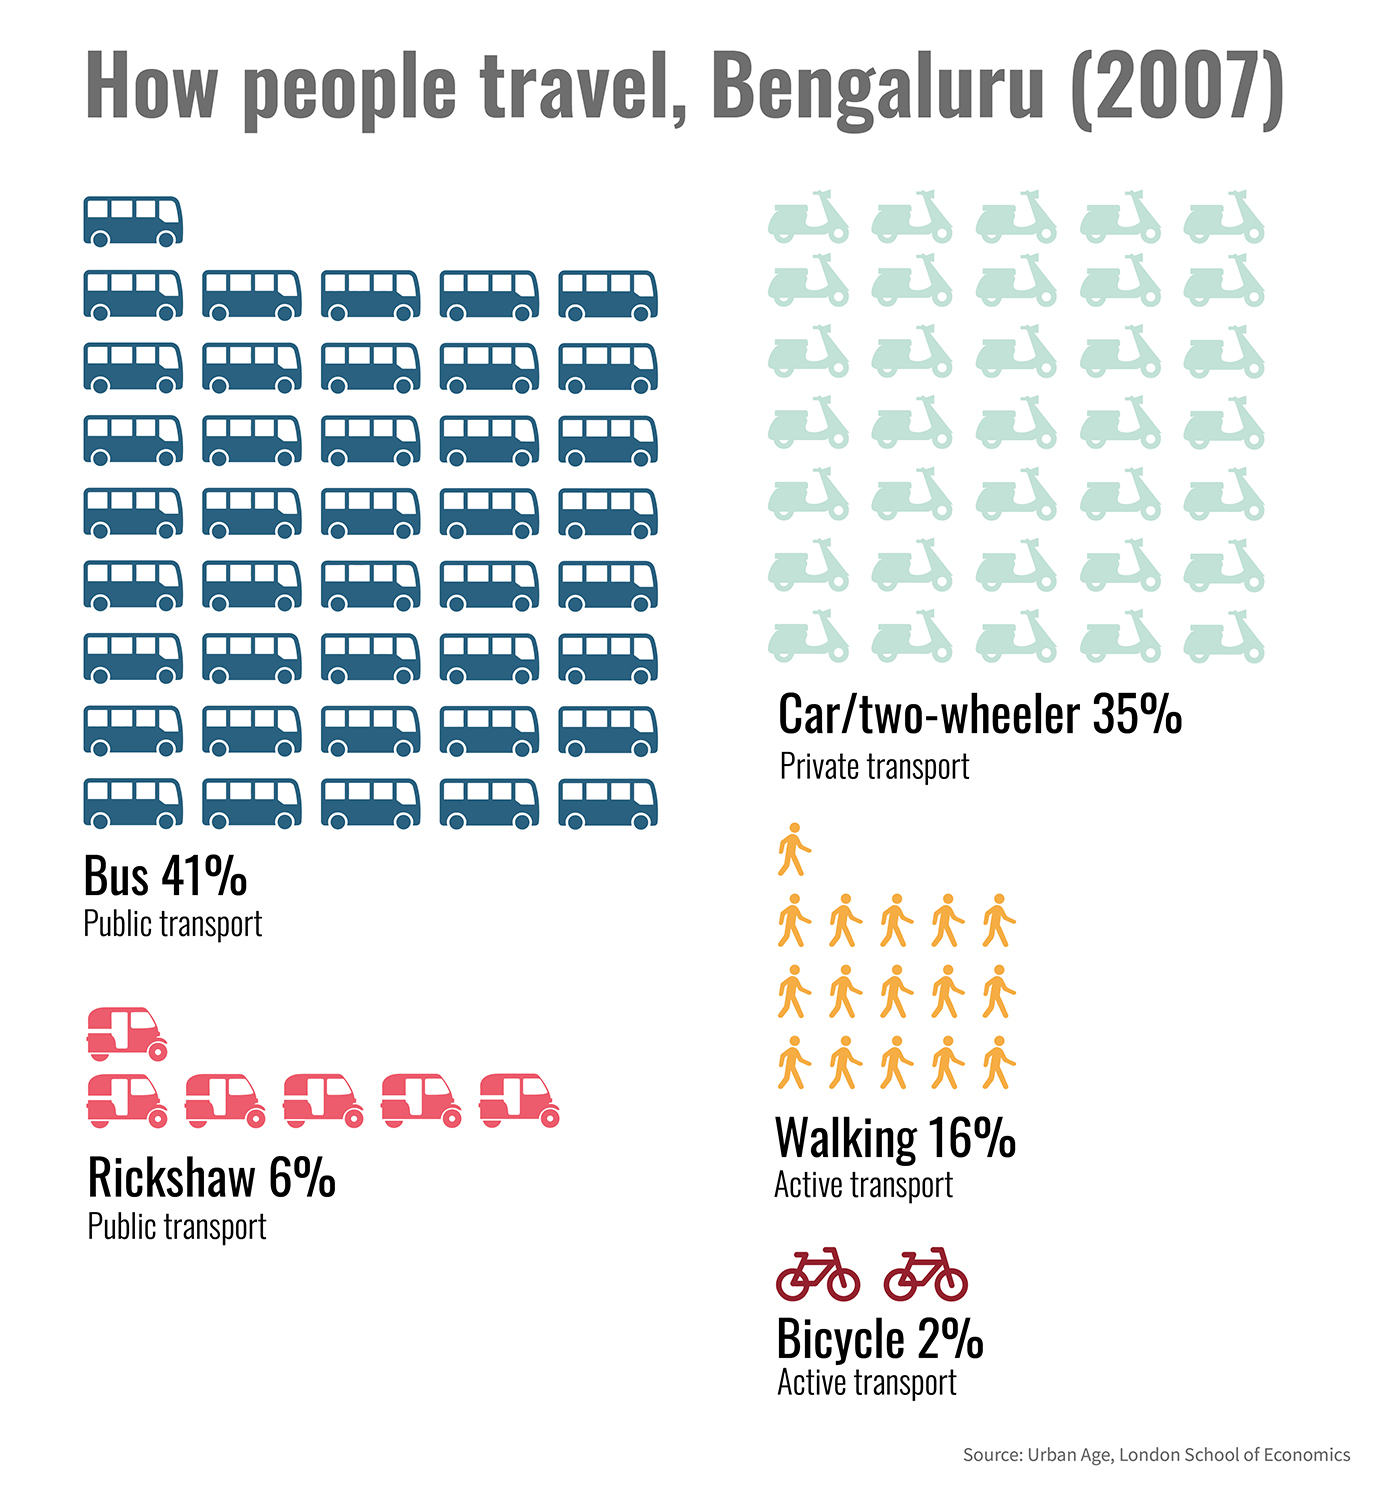
Percentages refer to all trips in each city except for Mumbai, Delhi and New York with commuter trips only.
“Indian cities have much lower levels of car ownership and use than their comparators, but themselves vary widely in the levels of walking, cycling and public transport use," says Urban Age.
Urbanisation of Bengaluru
This data shows how the population of Bengaluru has changed from mostly rural (55%) in 1901 to the vast majority living in urban areas by 2011 (90%). Press play on the second graph to see the changing land use in Bengaluru between 1973 and 2010.
