Soil as an asset has been overlooked for too long but the sector has now undoubtedly woken up to its value. It’s a hot topic and rightly so, as whether growing grass for livestock or planting seeds to grow grain or vegetables, it underpins everything we do. The earth’s soil was created millions of years ago. It varies with every step across a field, it changes each day and behaves differently depending on rain or shine. The soil’s texture, based on its proportions of sand, silt and clay, dictates what you can do with it. Its nutritional content, organic fraction and structural condition are all influenced by what activities you have carried out with it and this alters what uses you can put it to now.
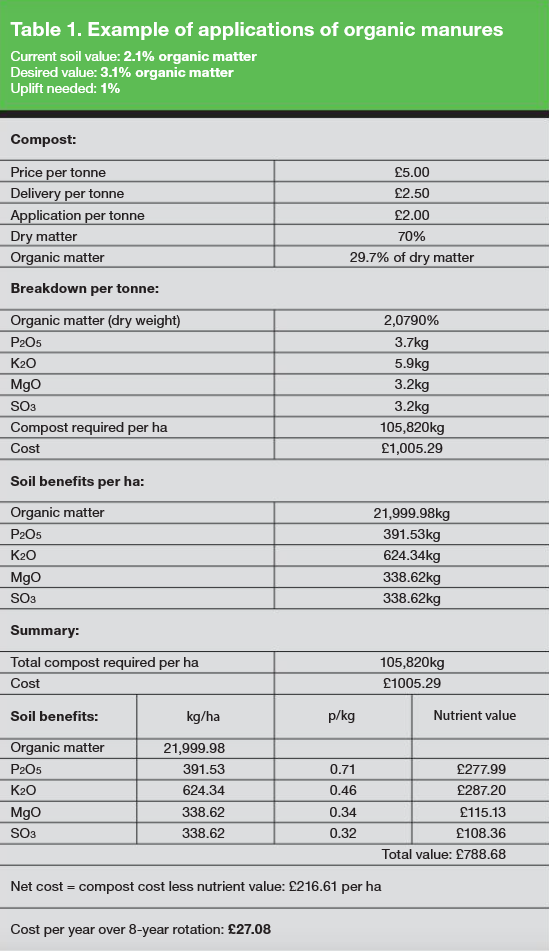
After a few decades, post-war UK agriculture became something of a victim of its own success. Producing cheaper and cheaper food and lowering the cost of production by striving for yield and specialisation has come at a cost. The changes that have taken place to achieve this and some of the effects on the soil are described in Table 1.

The impact of the past on today’s production can be surprisingly consistent year on year. We manage neighbouring farms under contract agreements that have had different histories, different rotations and therefore different soil conditions. For the same level of management and input they consistently return a different output. One example has given an 8% average increase in output between farms for the same level of input. At today’s prices that is £112 per hectare average on the bottom line for no apparent difference in cost or inputs. Over 10 years on 1,000ha that’s £1.12m.
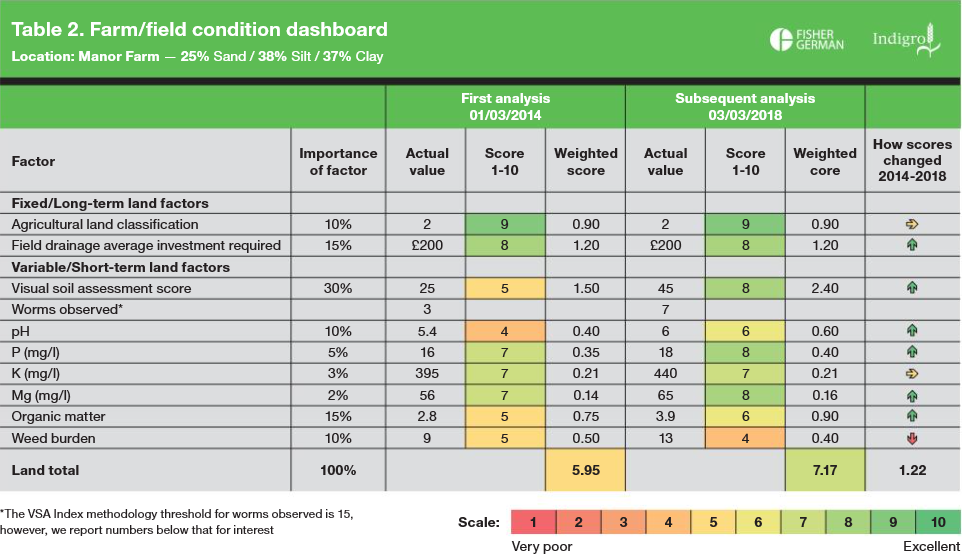
Soil benchmarking and valuation analysis helps us to monitor and make changes to affect these differences. The scientific measurement and interpretation has been carried out by Indigro, our agronomy partners. We have several farms and estates with a passion to reverse the adverse effects of farming on their soils and we are auditing, monitoring and benchmarking those changes with this tool. Table 2 shows the dashboard page from the Indigro and Fisher German matrix soils condition calculator. This shows the soil matrix scores from land analysed in 2014 and again in 2018.

The dashboard applies a weighted score to the parameters chosen to be measured and those scores are then factored to populate a total for that field or block.
In this hypothetical field example the condition score is at 5.95 when first measured and scored. The process is then repeated four years later, and each change is logged and the direction of travel as a result of management is demonstrated for each measurement, then the overall weighted score is calculated. In this case it has increased to 7.17 – a healthy improvement in a short period.
The calculations feeding into this are chosen from measurements we deemed essential to monitor the soil’s value and its improvement. It is based on a skilled and detailed farm-field-soil survey. Each element has a scaling system behind the spreadsheet that builds this matrix. The visual soil assessment (VSA) score and its scale is shown as an example.
The following parameters are measured.
-
Soil classification:
the bit you cannot alter but has an impact on the value is the traditional land classification. This has a low weighting.
-
Drainage:
the investment required in drainage for ditch or underdrain systems is long term and gets costed and valued within the scale.
-
VSA analysis:
probably the most important factor in the weighted score as it holds so much information about how productive the soil is and its current health. It’s an industry-recognised field soil analysis measurement, the results of which build into our matrix score.
-
pH status and liming requirement:
an elementary but vital factor for successful crop production.
-
Phosphate indices:
these are notoriously difficult and costly to improve. Both their minimum levels and, in the future, probably maximum levels need to be held to contribute to this score.
-
Potassium and magnesium levels:
contribute to the final weighted score.
-
Organic matter:
is monitored and scored. It makes such a difference to workability, shear strength, bulk density, water-holding capacity, nutrient retention and how quickly soils warm, hence it carries a high importance factor.
-
Weed burden:
included as part of the monitoring as it is essential for sustainable production to stabilise or reduce seedbanks of weeds such as blackgrass.
Costing the change
- Landlord and tenant can agree the matrix score at the beginning of the tenancy. Then it can be monitored at intervals and land returned in similar health and condition or compensation paid for loss or improvement to score.
- Investors and owners can take land at a given score, manage appropriately, monitor and benchmark progress to demonstrate the value added.
- The matrix and cost analysis options give you the investment required to influence the change you want.
- local sources and costs of manures
- changing cultivation systems
- cover crop use
- rotational changes including introducing grass in a rotation and even mob grazing systems.
"Farm management planning to predict and demonstrate how we can influence the soil status and score is where the tool really comes into its own and assists us"
Calculations and cost forecasts
All these factors influence the speed and the increase or decrease of organic matter in the soil. Our costing calculator starts with options of applying manures but can factor any of the influences that alter rate of organic matter change depending on the local and management constraints.
The first farm calculations have demonstrated some interesting net cost forecasts. It might be costly to apply 105t per hectare of a local manure over eight years of rotation and drill and grow cover crops at various intervals but is it worth the investment? The calculator values the savings in nutrition from the manures applied and predicts the increases achievable. A single percentage shift in soil organic matter would change water-holding capacity by around 200,000–224,000 litres per hectare; provide sufficient food for 750–1,000kg earthworm biomass and lift soil mineral nitrogen by 80–100kg per hectare (of which between 20–30kg would be plant-available over six–12 months).
For a soil bulk density of 1.45 gm/cm3, a value of 1% soil organic matter equates to 16.8t of organic carbon per hectare. As the world asks us to work on ways to sequestrate carbon, here lies part of the answer and technique and cost to understand how to do just that.
