Variations in levels of urban tree cover are something that most of us experience every day. However, until now relatively little has been known about inequality in tree cover at a national level – or how to deal with this in policy or practice.
The online Tree Equity Score tool was therefore launched in the UK last December to highlight such inequalities across the UK nations, and everyone can access it free of charge.
Inequality implies differences between individuals or population groups, inequity refers to unnecessary and avoidable differences that are also considered unfair and unjust.
The extent to which differences in tree cover are unfair in the UK is an emerging subject. But initial data analysis lends itself to the support and development of the Tree Equity Score. It is clear there is an intersection between tree cover and socio-economic indicators such as income.
On average, the most affluent neighbourhoods in the UK have more than 50% more tree cover than the least affluent neighbourhoods.
'On average, the most affluent neighbourhoods in the UK have more than 50% more tree cover than the least affluent neighbourhoods'
Racism led to less greenery in some US neighbourhoods
Developed by non-profit organisation American Forests, the tool was launched in the US in 2021 to identify similar inequities.
These are often the result of racial discrimination: in the 1930s, the unethical housing policy of redlining meant government officials labelled immigrant neighbourhoods as risky investments, preventing potential homebuyers from obtaining mortgages.
Decades of systemic underinvestment in these areas resulted in less greenery and more concrete. A 2020 study Residential housing segregation and urban tree canopy in 37 US cities found that, on average, previously redlined neighbourhoods have roughly half the amount of tree cover of those that are not redlined, and the former are now up to 7°C hotter in summer.
The score is now being used by national and state governments, city authorities and community groups in the US to tackle such inequity by targeting investment in planting in neighbourhoods where increasing tree cover would make the biggest difference to people's quality of life.
Dedicated tool developed for UK
Recognising that tree inequity was apparent in many UK towns and cities too, American Forests and UK charities the Woodland Trust and the Centre for Sustainable Healthcare partnered to develop a dedicated version of the tool in 2022.
This displays tree equity scores and other related information at neighbourhood or local authority level, as determined by the user. It uses the statistical geography of what are termed lower-layer super output areas in England and Wales and data zones in Scotland and Northern Ireland. For general purposes these can be referred to as neighbourhoods.
A tree equity score out of 100 has been calculated for more than 34,000 urban neighbourhoods in the UK and for every local authority, along with a rating of high, moderate or low priority for tree equity. The lower the score, the greater the need for trees and the higher the priority for investment. The score is a measure of the benefits of trees in that area.
The tool combines socio-demographic data from the census and indices of multiple deprivation, with neighbourhood-level data on air quality, surface temperature and tree canopy cover. Development of the UK version of the score included quality assurance testing of the canopy cover dataset, comparing it with existing data from a range of sources including the UK urban canopy cover map, developed by Forest Research in partnership with the Woodland Trust and Trees For Cities on urban tree cover.

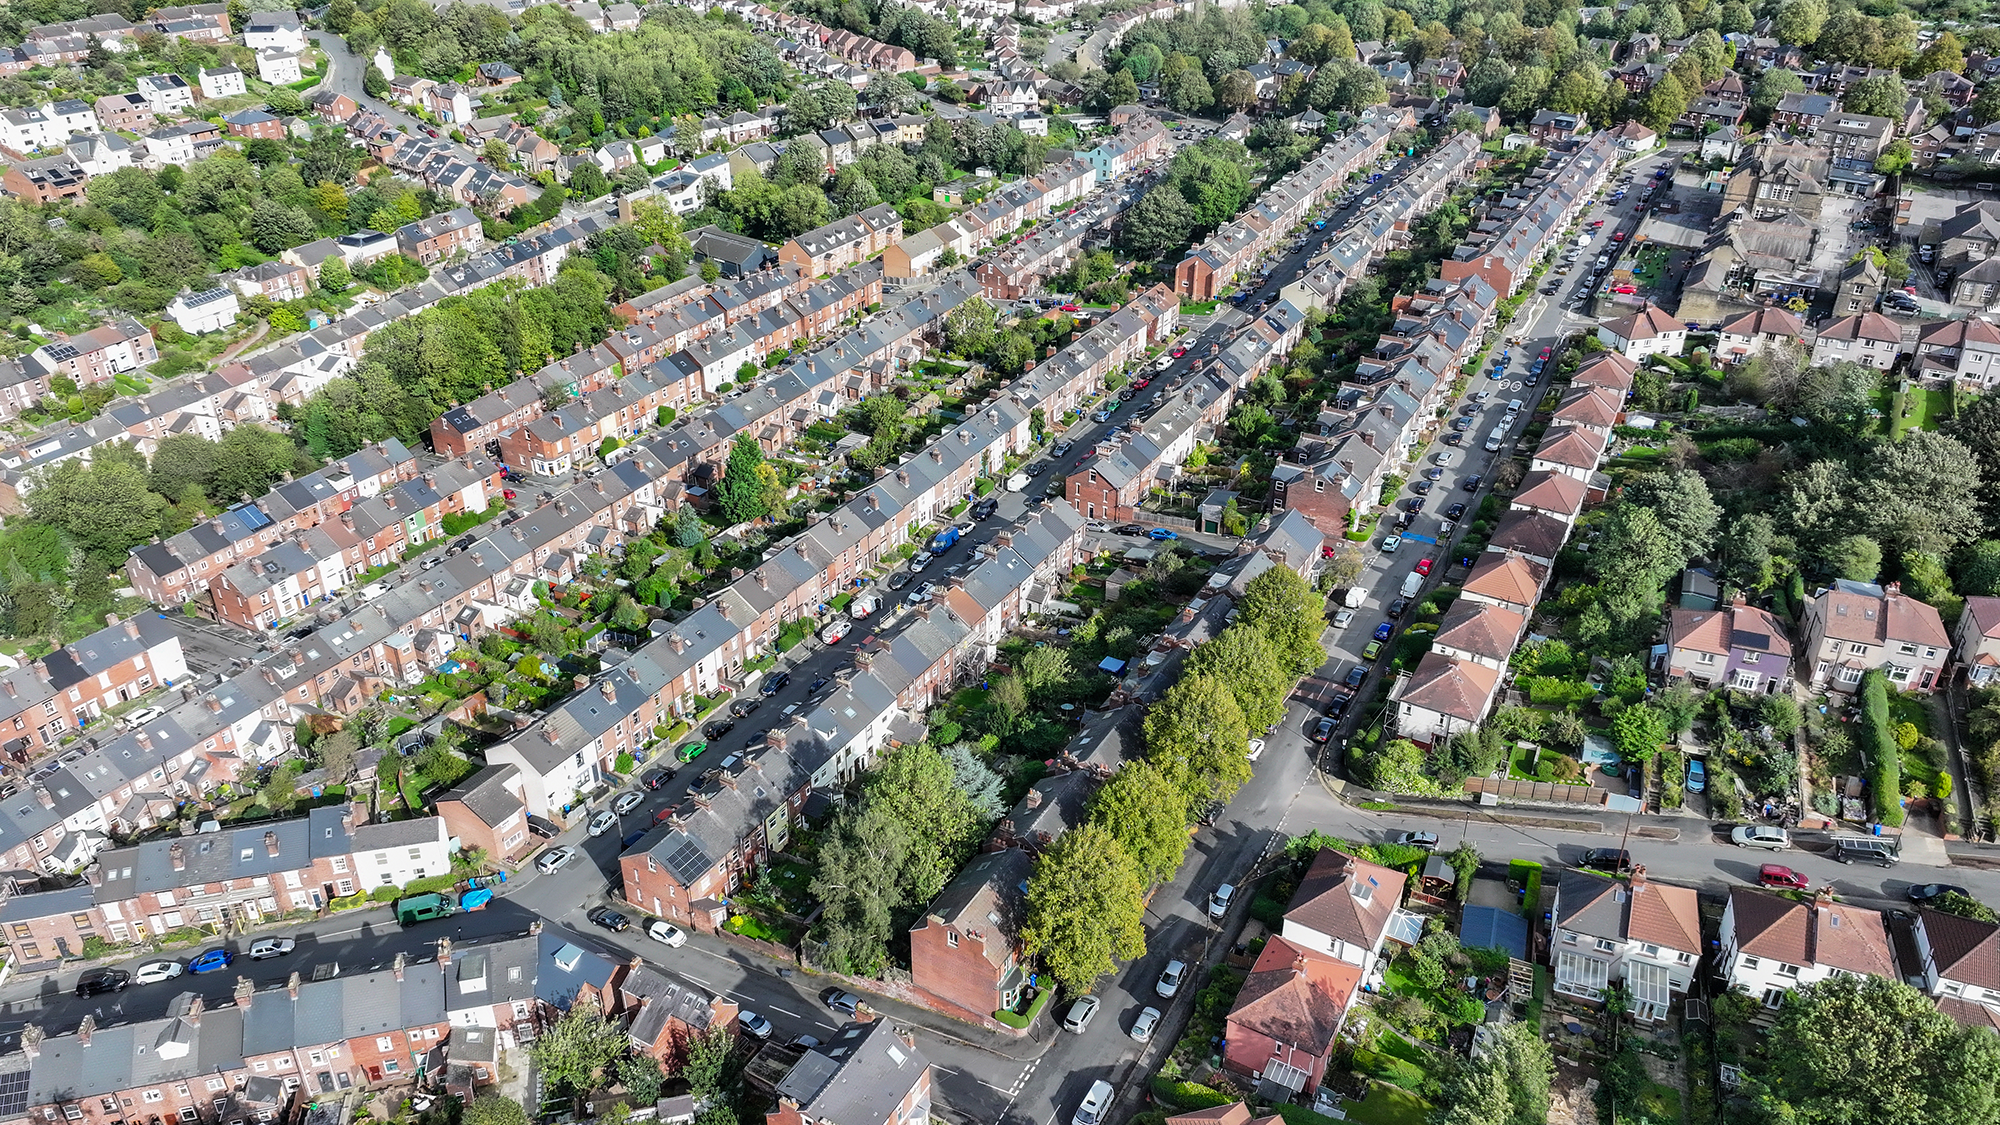
Neighbourhood in Sheffield with a Tree Equity Score of 100. © James Reader, Woodland Trust Media Library

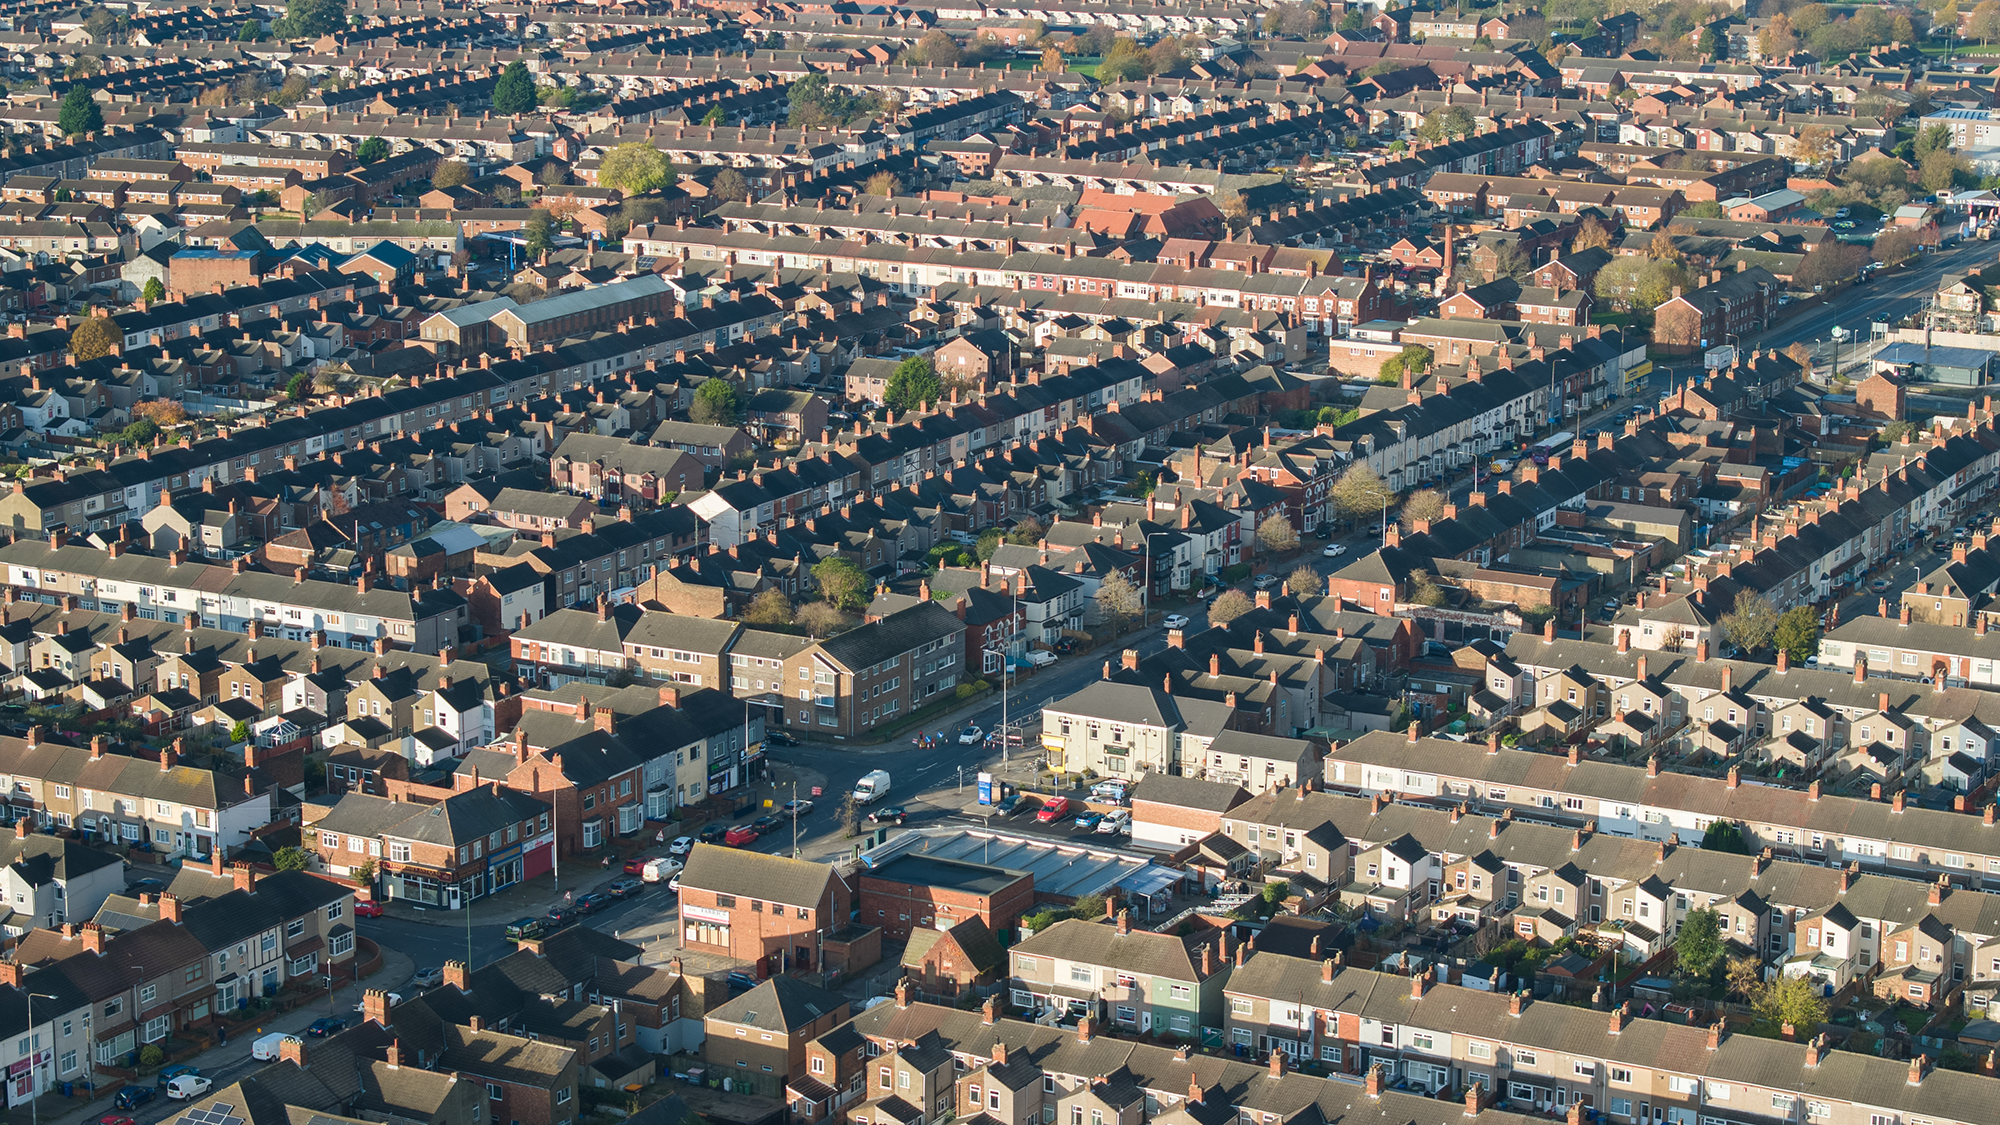
Grimsby neighbourhood with a Tree Equity Score of 61. © James Reader, Woodland Trust Media Library
Process depends on local context
The methodology for calculating scores is outlined in detail on the website but can be summarised as follows.
- Set the geographic scale of local authority or neighbourhood.
- Set a tree canopy goal, starting at a 30% baseline derived from existing canopy goals and research on public health benefits.
- Adjust for population density to make the goals more achievable.
- Determine the canopy gap by subtracting the current level of cover from the goal, showing where there is a lack of trees.
- Use socio-economic indicators to prioritise areas for action; the six indicators are air quality, age, employment, health, income and heat severity. The values are then normalised and combined to create a priority index with values from zero to one. A zero represents the lowest-priority area, and one represents the highest-priority area.
- Generate a tree equity score out of 100 at a neighbourhood level by multiplying the canopy cover gap and the priority index, subtracting that value from one and then multiplying by 100. If you selected local authority scale, neighbourhood scores are aggregated to local authority level.
Maps and reports enable data analysis
The online tree equity score map displays this information visually, with higher-priority neighbourhoods coloured orange and lower-priority ones green. Users can also layer and filter to identify patterns and isolate areas of interest on important local issues. For example, you can set the heat disparity filter to identify neighbourhoods at risk of extreme heat.
All local authorities can generate tree equity reports instantly using information from i-Tree to calculate the benefits and associated ecosystem services of increasing tree canopy cover. i-Tree is a peer-reviewed software suite from the USDA Forest Service that provides urban and rural forestry analysis and benefits assessment tools.
Even a cursory glance at the map shows that inequalities are commonplace. Most towns and cities have neighbourhoods that are orange and green, sometimes adjacent to one another.
Some initial data analysis has identified national patterns and trends. The key findings so far are:
- the most affluent neighbourhoods have more than double the tree cover per person than the least affluent
- neighbourhoods where tree cover per person is highest have roughly 30% less nitrogen dioxide pollution, 10% less PM2.5 pollution and are 4°C cooler during a heatwave
- neighbourhoods with the most people identifying as part of a minority ethnic group have roughly half the average amount of tree canopy cover per person.
What the map doesn't tell us is why these inequalities exist. Tree equity in the UK is a consequence of a complex mix of urban planning, social history, and discrimination and immigration patterns and policies.
Local circumstances vary, and factors such as building density have a huge impact on where trees have been planted. Nevertheless, the patterns of inequality in urban tree cover are similar across the UK.
Forest Research, the research agency of the Forestry Commission, measured the average tree canopy cover in 283 towns and cities in England in 2016. The average is 16%, with significant differences between places, ranging from 3% in Fleetwood, Lancashire to 45% in Farnham, Surrey. In Wales, meanwhile, urban canopy cover was measured at 16.3% in 2013.
There are often significant differences within towns as well. In London tree cover ranges from 58% in Hampstead to 2.4% in the City of London.
Health benefits of tree equity are clear
A major challenge facing planners, landscape architects and people living in towns and cities is the fundamental mismatch between 19th-century street layouts and 21st-century climate.
Streets originally designed for horses and carts now need to accommodate more modern forms of transport, but they also need to have space for trees to help protect residents against the impacts of climate change. The tree equity score helps to pinpoint where trees are lacking and make the case for investing in them as critical infrastructure – essential for public health and climate resilience.
Public Health England, the government's health adviser, has summarised the evidence for links between green space and health in Improving access to greenspace – A new review for 2020.
This says: 'People who have greater exposure to greenspace have a range of more favourable physiological outcomes … Disadvantaged groups appear to gain a larger health benefit and have reduced socio[-]economic-related inequalities in health when living in greener communities, so greenspace and a greener urban environment can also be used as an important tool in the drive to build a fairer society.'
Meanwhile, a 2023 UN policy brief on sustainable urban and peri-urban forestry (SUPF) says: 'The many benefits … need to be delivered to all urban residents, irrespective of age, gender, income, education, and cultural background. Environmental equity in terms of the fair and equal distribution of the benefits should be part of any SUPF programme.
'Research has clearly demonstrated that people benefit optimally when they have easy and immediate access to UPF, such as seeing trees from their window, having a decent canopy cover in their neighbourhood, and being no more than a five-minute walk to the nearest public green space.'
Every new development has the potential to affect tree equity at a neighbourhood level. The tree equity score offers environmental professionals an evidence-based means of assessing levels of urban tree canopy cover.
By using the score, surveyors can contextualise the impact of new developments and the social value of mitigation through tree planting efforts as part of a range of urban greening measures.
This will be especially important in areas with low tree equity scores, which can be boosted by well-designed developments rich in trees, particularly if combined with planting in the neighbourhood surrounding a development site.
Score can influence valuers' ESG consideration
The tree equity score is not intended as a tool to assist directly in valuations. However, as with all data collection and processing, there are secondary uses and benefits.
One such use may be to help benchmark comparable data about a geographic area. This would undoubtedly add rigour to assumptions and generalisations about employment, income and health in a particular location.
There is also merit in using the tree equity score where environmental, social and corporate governance (ESG) considerations apply. Many readers will be aware that such factors have become significant in property valuation as a result of regulatory requirements, stakeholder expectations and risk management.
In terms of valuing properties, RICS Valuation – Global Standards (Red Book Global Standards) VPS 2 paragraph 1.5 states that, wherever appropriate, the relevance and significance of sustainability and ESG matters should form an integral part of the valuation approach and reasoning for the reported figure.
Furthermore, Red Book Global Standards VPGA 8 provides detailed commentary on matters evident or to be considered during inspection of real estate, including those that fall under the general heading of sustainability and ESG issues.
Such factors are commonly important in terms of market and societal perception and influence, and valuers should have proper regard to their relevance and significance in relation to individual valuation assignments.
A recent RICS World Built Environment Forum paper The future of real estate valuations: the impact of ESG indicated that not all such considerations currently form an implicit part of valuation investigations and reporting.
Despite this, there are already companies that prioritise ESG in their property portfolios to enhance their reputation, strengthen stakeholder relationships and contribute to long-term value creation. Consequently valuers can play their role by considering ESG factors directly relating to real estate to produce comprehensive and forward-looking valuations.
This innovative tool is a game-changer in the quest to understand and improve tree coverage in urban areas. We all know that trees are not just beautiful; they're vital for our health, environment, and communities. Yet not all neighbourhoods are equal.
That's where tree equity comes in, ensuring a more strategic and fair distribution across all urban areas. By focusing our efforts in areas with a low Tree Equity Score, we're not just planting trees; we're planting hope, health, and happiness in communities that need it most.
Ed Randall MRICS is land and property manager South West, Woodland Trust
Related competencies include: Management and regeneration of the built environment, Management of the natural environment and landscape, Masterplanning and urban design, Planning and development management
RICS UK Rural Conference 2024
26 June | 08:00–17:00 BST | Royal Agricultural University, Cirencester
RICS rural conference 2024 is of interest to those working in the rural sector, from farmers, landowners, land managers and surveyors, to rural property valuers and environmental professionals.
This year's event will cover opportunities in international and domestic carbon markets, with specific reference to RICS' brand new practice information paper, plus updates on biodiversity net gain, and geospatial data. Find out the latest on DEFRA's funding and the Rock Review.
In addition, speakers from OFWAT and water companies will showcase examples of how they are dealing with challenges in the water sector and what more needs to be done.
Case studies from those working in the rural sector will offer practical solutions to rural professionals and there will be plenty of opportunity to network with your peers.


