Around 99% of the world’s population live in areas where the air quality does not meet World Health Organization (WHO) guidelines. It’s a statistic that’s all the more shocking when you consider that air pollution is the fourth biggest threat to human health, behind high blood pressure, dietary risks and smoking.
The built environment contributes nearly 40% of global carbon emissions, so it could have a huge impact on air quality if it can significantly reduce this number in the coming years.
Global CO2 emissions since 1750
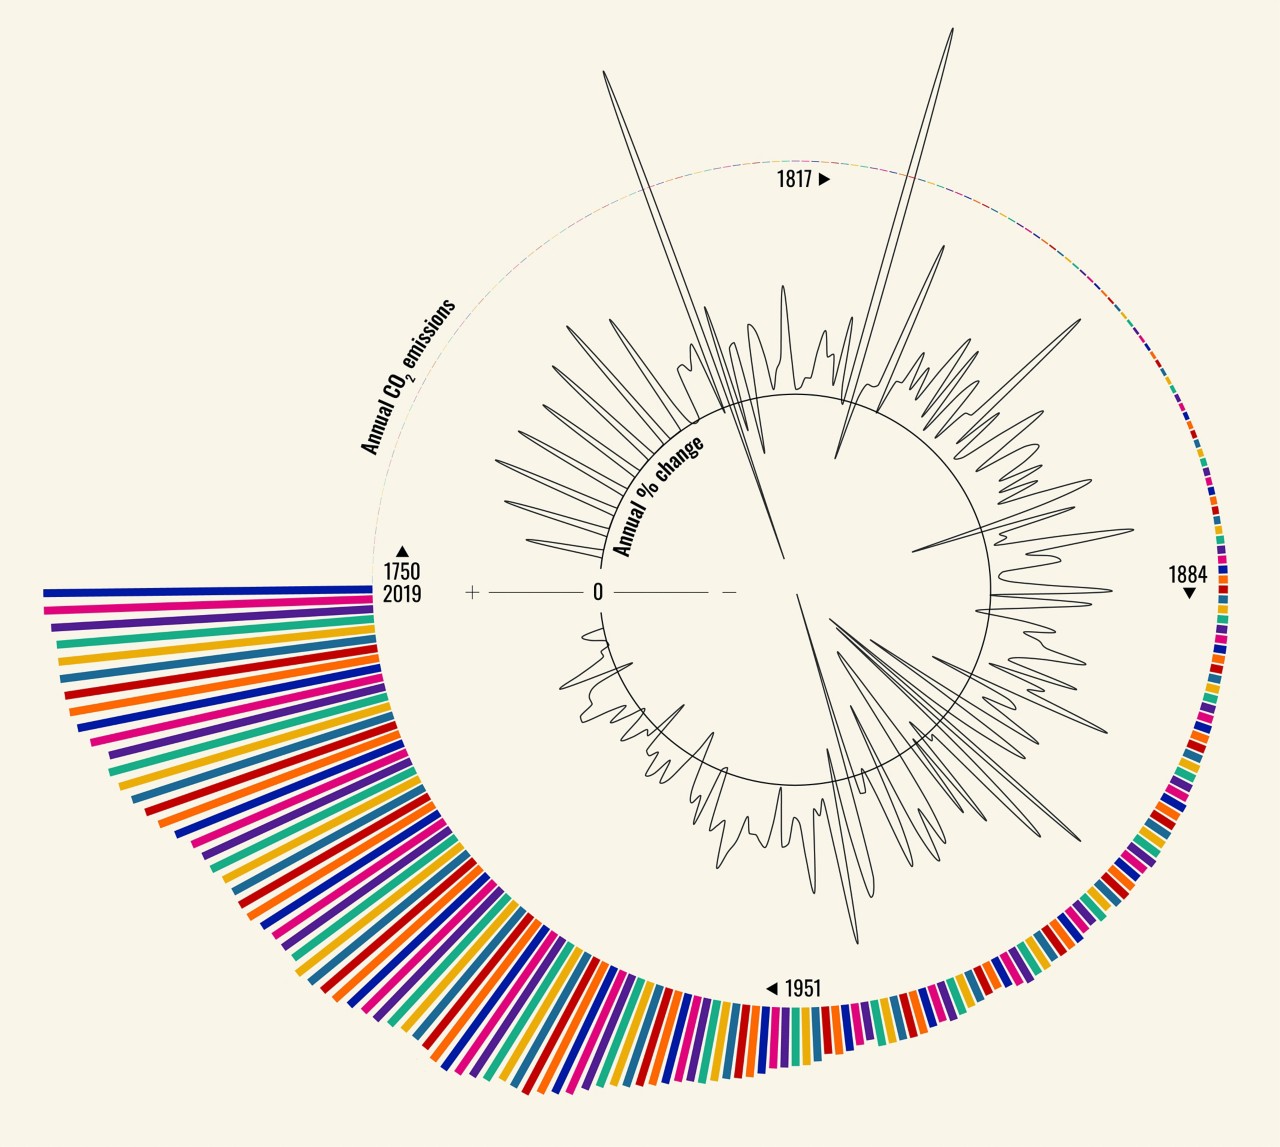
This graph shows the world’s CO2 emissions between 1750 and 2019.
The outside circle shows the annual global CO2 emissions in tonnes, caused by the burning of fossil fuels for energy and cement production.
The inner circle shows the year-on-year percentage change in CO2 emissions from fossil fuels and cement production. The black circle is 0; lines which go above the black circle depict an increase in CO2 emissions, and the lines that go below the black circle show a decrease in emissions
The period of the first and second industrial revolutions (1760-1900) has some very large spikes, but from around 1950 onwards the year-on-year changes became less pronounced. This is because many countries around the world were reaching similar levels of industrialisation. However, from this time the total annual CO2 emissions in tonnes also start to increase rapidly. In 1950, emissions were just under 6bn tonnes, 1960 hit 9bn, 1970 was 14bn, 1980 was 19bn tonnes. In 2019, we emitted 36.4bn tonnes of CO2.
You can track certain world events by the year-on-year changes in CO2 emissions, such as a decrease of nearly 17% in 1945 at the end of World War Two or the 2008 Financial Crisis leading to a 1.5% fall in emissions in 2009.
Per capita CO2 emissions in 2019 (tonnes)
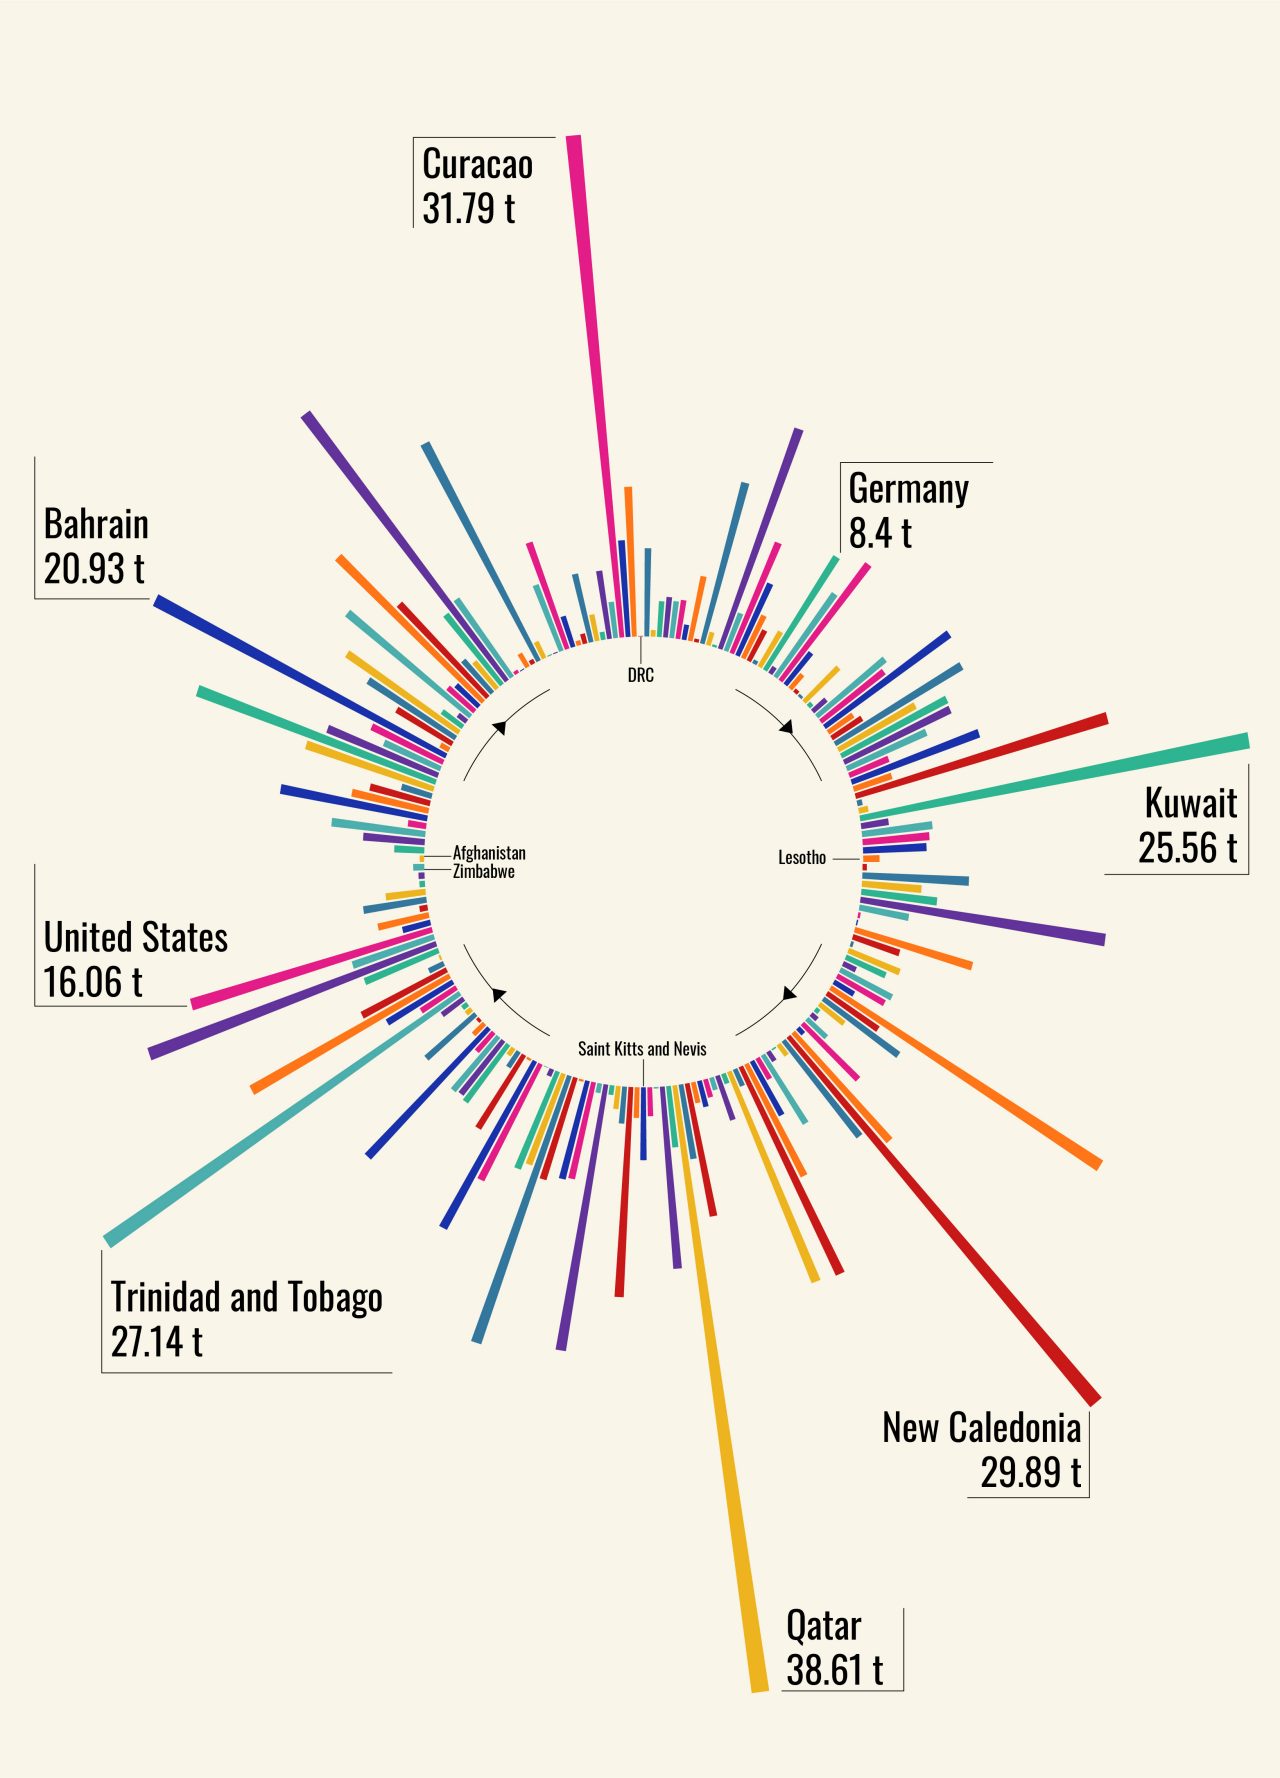
This graph shows countries’ per capita CO2 emissions from the burning of fossil fuels for energy and cement production in 2019.
Our World in Data says: “The world’s largest per capita CO2 emitters are the major oil producing countries; this is particularly true for those with relatively low population size.”
In 2019, Qatar had the highest emissions at 38.61 tonnes per person, followed by Curacao (31.79), New Caledonia (29.89), Trinidad and Tobago (27.14), Kuwait (25.56), Brunei (20.98) and Bahrain (20.93)
“More populous countries with some of the highest per capita emissions – and therefore high total emissions – are the United States, Australia, and Canada,” adds Our World in Data.
“Some European countries have emissions not far from the global average: In 2017 emissions in Portugal were 5.3 tonnes (t); 5.5t in France; and 5.8t per person in the UK. This is also much lower than some of their neighbours with similar standards of living, such as Germany, the Netherlands, or Belgium.
“The choice of energy sources plays a key role: in the UK, Portugal and France, a much higher share of electricity is produced from nuclear and renewable sources. This means a much lower share of electricity is produced from fossil fuels: in 2015, only 6% of France’s electricity came from fossil fuels, compared to 55% in Germany.
“Prosperity is a primary cause of CO2 emissions, but clearly policy and technological choices make a difference.”
CO2 emissions per region, 1900 - 2019
This graph shows the annual total CO2 emissions by world region, from 1900 to 2019, created by the burning of fossil fuels for energy and cement production. From the centre point, the bars go clockwise from 1900 to 2019. More than 90% of emissions were created by Europe in 1900 but by the second half of the 20th century, there was a significant increase in emissions from other parts of the world, especially China and Asia more broadly.

China is now the world’s largest cement producer by a huge margin – in 2019 it produced 2.2bn tonnes of cement. India, the world’s second largest cement producer, managed 320m tonnes, just under seven times less than China.
Concrete is responsible for around 8% of all global man-made emissions. The way we use and produce it will play a significant role in any attempts we make to reduce our emissions.
Index of air quality in the US, 1980 vs 2019
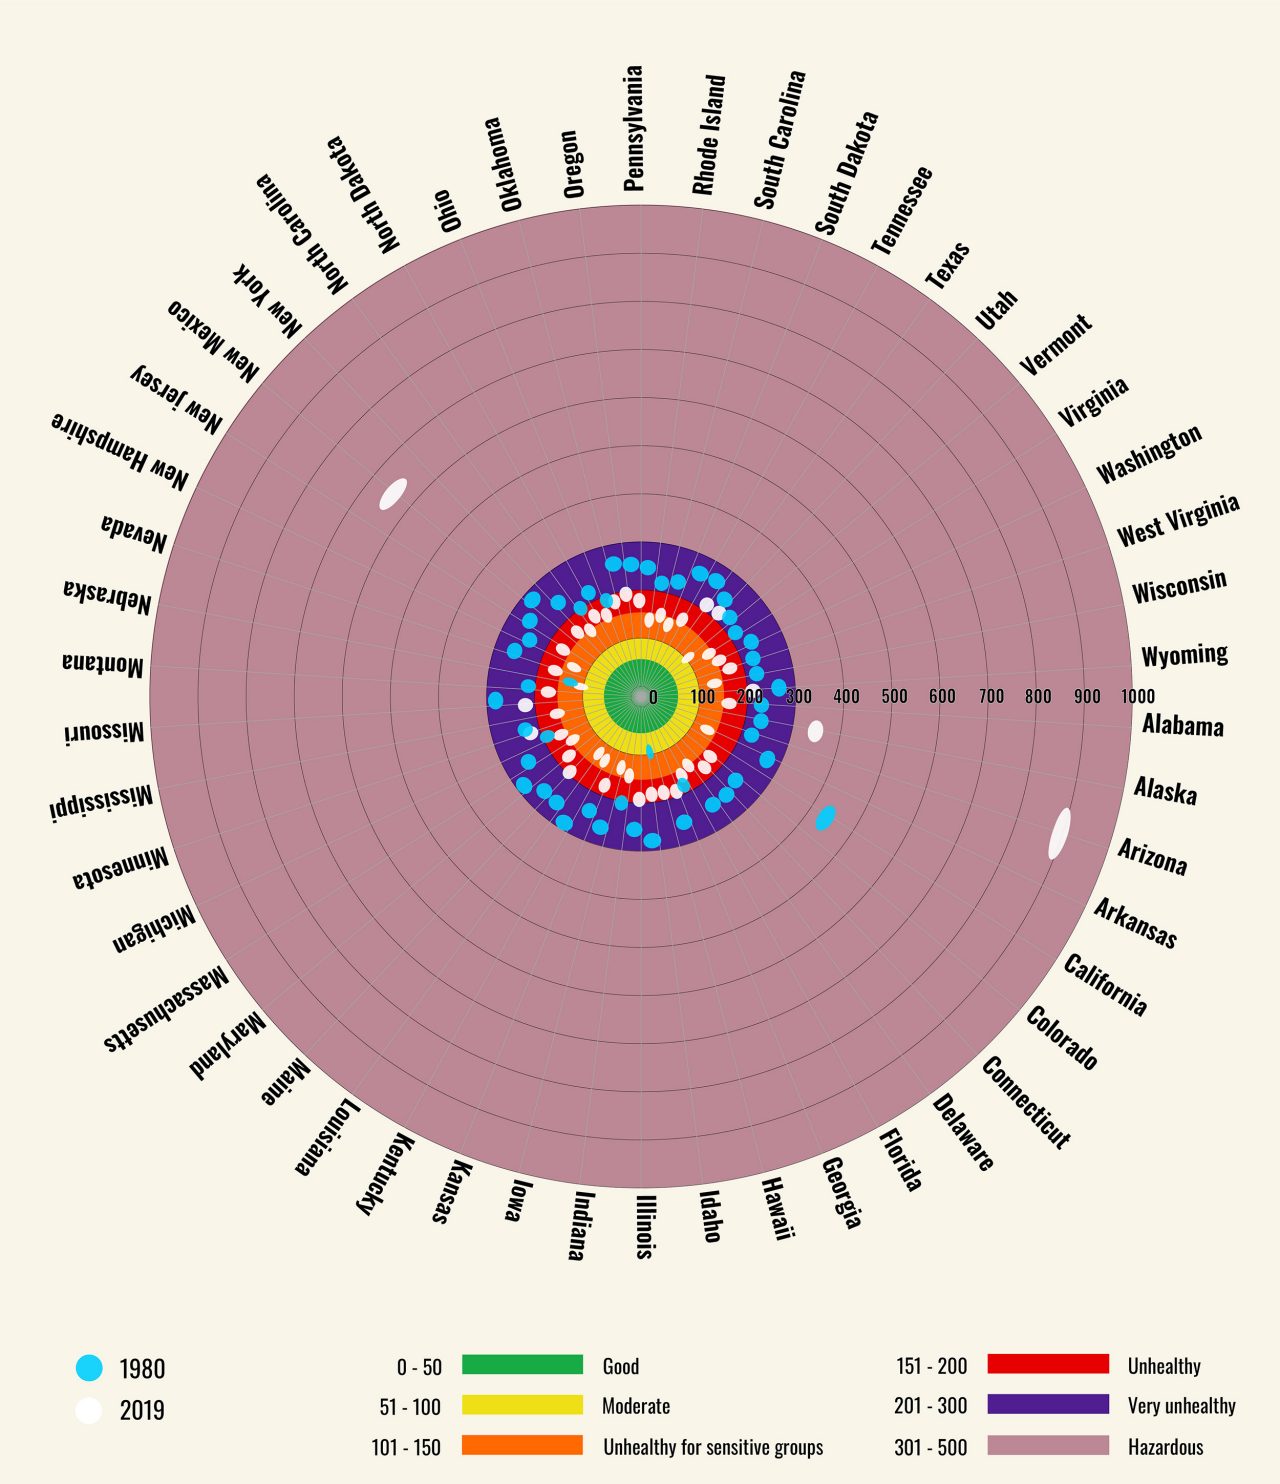
This graph shows the Air Quality Index in the US, comparing 1980 and 2019. Each dot is the highest recorded AQI reading from each state that year, based on daily recordings of air quality. A lower score means cleaner air.
A score of 0 - 50 = good, 51 - 100 = moderate, 101 - 150 = unhealthy for sensitive groups, 151 - 200 = unhealthy, 201 - 300 = very unhealthy, and 301 - 500 = hazardous.
Blue is 1980, and white is 2019, so we can clearly see that air quality has improved in a lot of places in the US in the past 40 years. It may be surprising to see air quality has improved, but it shows we’re on the right track. It also echoes the emissions graph at the top of this article, which shows the year-on-year percentage increase in emissions is slowly levelling off.
In 2019, 99% of the world population was living in places where the WHO air quality guidelines levels were not met.
Global levels of PM2.5 and PM10
Particulate matter is a mixture of ultra-fine solid and liquid particles in the air. Particles that have a diameter of less than 2.5 micrometres are known as PM2.5 and come from burning fossil fuels and chemicals combining in the air.
Particles that have a diameter less than 10 micrometres are known as PM10 and are caused by dust from construction sites, wildfires and industrial processes.
These graphs show the PM2.5 levels around the world, and the number of related deaths because of it. They also show that the risk to health from pollution is much higher in countries with a lower average income.
There have also been studies which show there are more COVID-19 deaths in highly polluted areas.
PM2.5 exposure amongst racial-ethnic groups in the US, 2014
This data comes from Science Advances and shows that black, Hispanic and Asian communities are disproportionately affected by poor air quality in the US. Each circle shows the PM2.5 exposure per racial-ethnic group. The concentration of an air pollutant such as PM2.5 is given in micrograms per cubic meter air or µg/m3. The average exposure in the US is 6.5 µg m-3; the average exposure for white communities is 5.9 µg m-3, whereas for black communities it's 7.9 µg m-3.

In an introduction to the Science Advances study, one of its authors, University of Illinois professor Christopher Tessum, says: “Racial-ethnic and socioeconomic disparities in air pollution exposure in the United States are well documented and have persisted despite overall decreases in PM2.5 pollution."
The US also has issues of inequality in home valuation and a racial wealth gap – a problem shared by the UK.
In 2014, the average PM2.5 exposure in the US was 6.5 µg m-3.