When the UN’s Intergovernmental Panel on Climate Change (IPCC) report, ‘Climate Change 2021: The Physical Science Basis’ was published earlier this year, it was described as a “code red” for humanity by the UN general secretary António Guterres.
It set out a 1.5°C global warming limit that the world must stay below to avoid catastrophic climate change in future. This was an even starker target than the 2°C target agreed upon six years previously within the 2015 Paris Agreement.
The alarm bell has been sounded and now it is up to chartered surveyors, construction industries and FM professionals to find tangible ways to reduce emissions throughout the property lifecycle. Swift action is required to stop the planet from heating up by more than 1.5°C – the tipping point at which the damage we do could be irreversible - only then can we say we have made a difference.
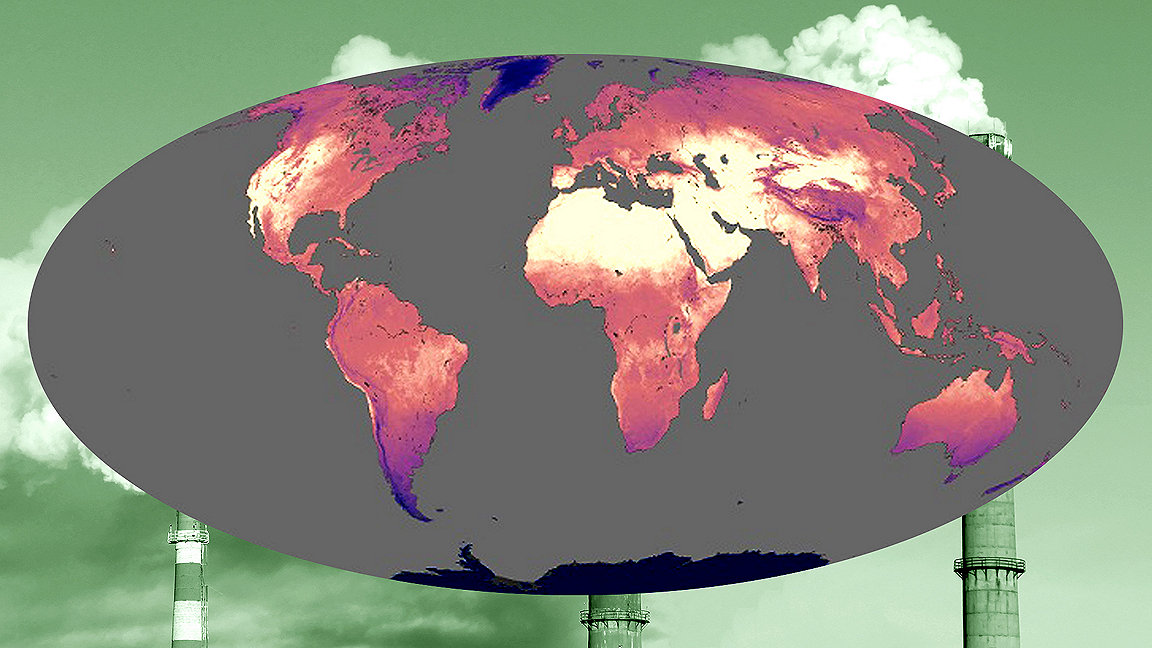
The planet has already warmed by nearly 1°C because of man-made emissions such as burning fossil fuels. The temperature anomaly chart above shows the difference in temperature between a particular year and the average temperature between 1961-1990. (This 29-year period is the standard range used when measuring climate change.)
The last decade was hotter than any period in the past 125,000 years. And atmospheric carbon dioxide (CO2) levels are now at a 2m year peak. Our steady consumption of fossil fuels has combined with agriculture to push methane and nitrous oxide – also greenhouse gases – to record highs for at least the last 400,000 years.
The graph above shows global CO2 levels in the atmosphere since 400,000 BCE.
Currently, around 2.6 million pounds of carbon dioxide per second are released into the atmosphere every second and that number is rising.
Writing for the World Business Council for Sustainable Development, Arcadis CEO Peter Oosterveer said: “The World Green Building Council has found that buildings and construction account for a massive 39% of all carbon emissions in the world, with 28% being related to energy expended lighting, heating, and cooling buildings (operational carbon) and the remaining 11% from energy use, related to producing construction materials (embodied carbon).”
But as Our World in Data highlights: “It’s not only the level of CO2 in the atmosphere that matters, but also the rate that this has changed. Historical changes in CO2 concentrations tended to occur over centuries or even thousands of years. It has taken us a matter of decades to achieve even larger changes. This gives species and ecosystems much less time to adapt.”
The 5 shared socioeconomic pathways from the IPCC report
Depending on our success at tackling global warming, there are five predicted socioeconomic pathways we could follow, as described by academic Keywan Riahi in his 2017 research paper ‘The Shared Socioeconomic Pathways and their energy, land use, and greenhouse gas emissions implications’.
These five shared socioeconomic pathways (SSPs) are used throughout the IPCC report to cover the different emission scenarios the world could face (from very high to very low), based on the action we take now. The report states that they were developed to: “connect a wide range of research communities and provide them with a consistent set of quantitative narrative storylines describing societal futures.”
Estimated changes in surface temperatures worldwide between 2021 and 2100, by scenario
Comparison of very low and very high scenarios
Swipe to compare the different impacts on the climate by 2100, contrasting the very low emissions scenario (taking the green road), and the very high emissions scenario (taking the highway).
In the best-case scenario sea levels will rise by 0.38m and in the worst by 0.77m
(Global average annual precipitation over land and global mean sea level rise is relative to 1995-2014.)
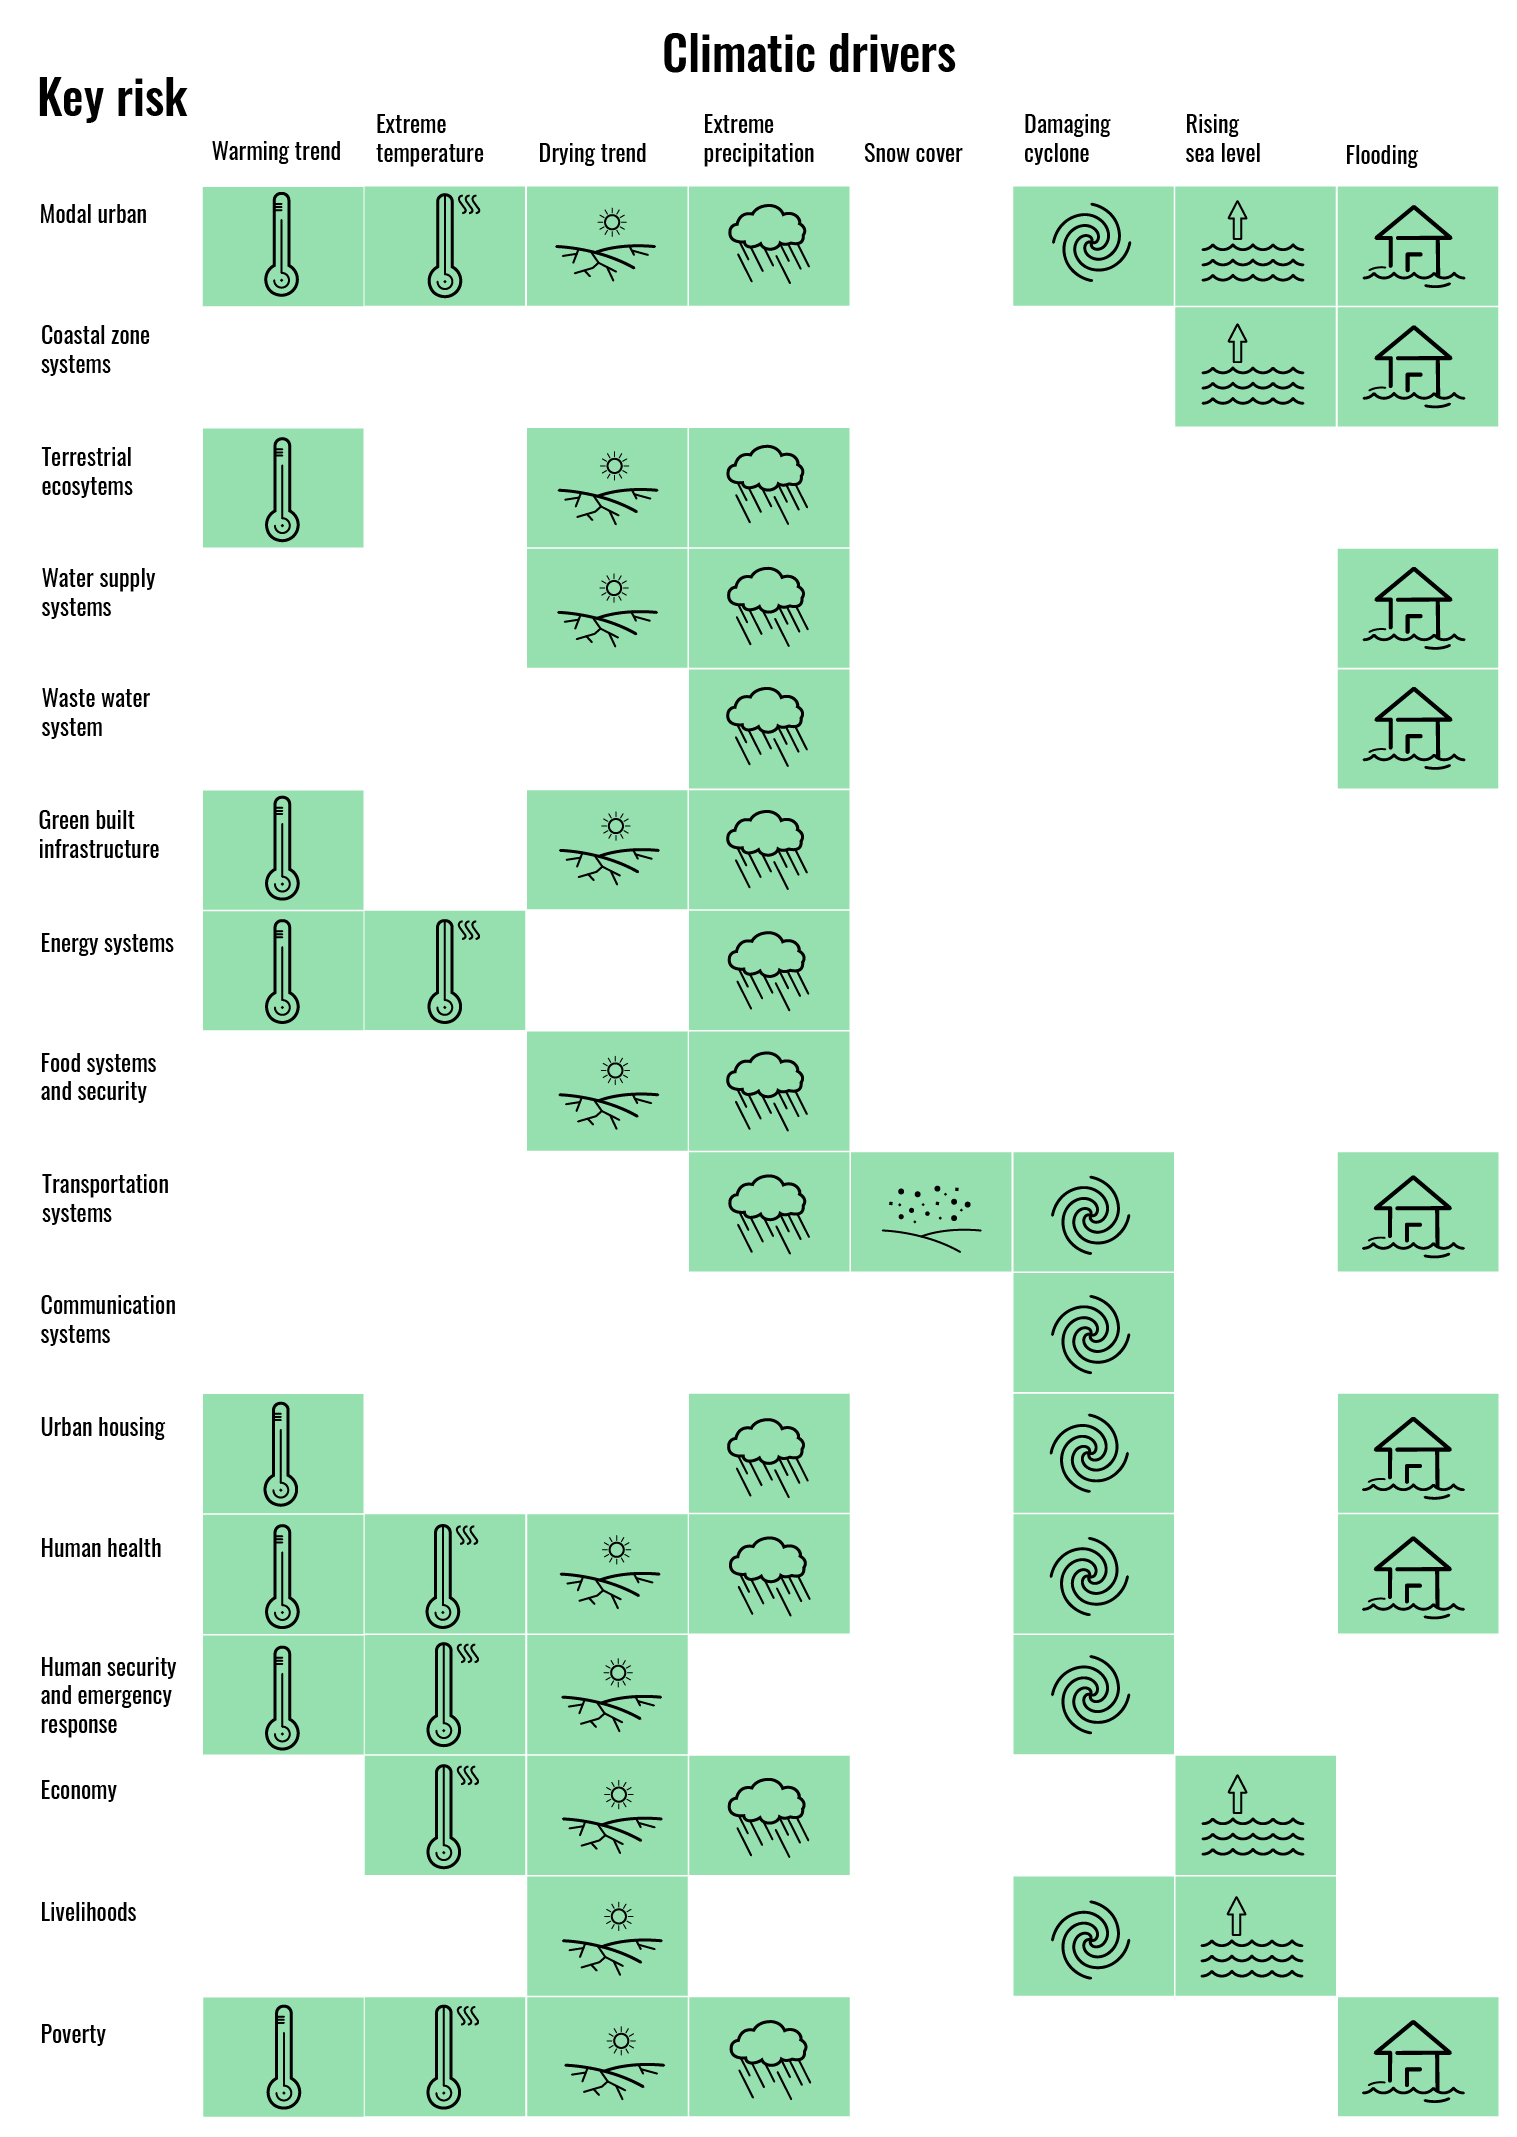
The risks we face from climate disasters
The grid below lists eight climate impact drivers (CDI) and the different risks we face from them.

The 75 per cent problem
Read the series on the 75 per cent problem posed by Bill Gates – how the world can reduce three-quarters of man-made emissions by 2050 to avoid catastrophic climate change.

